-
 Australia
-
 Austria
-
 Belgium
-
 Brazil
-
 Canada
-
 China
China
-
 Czech Republic
-
 Denmark
-
 Finland
-
 France
-
 Germany
-
 Greece
-
 Hong Kong
-
 Hungary
-
 Iceland
-
 India
India
-
 Ireland
-
 Israel
-
 Italy
Italy
-
 Japan
Japan
-
 Korea
Korea
-
 Luxembourg
-
 Malaysia
-
 Netherlands
-
 New Zealand
-
 Norway
-
 Poland
-
 Qatar
Qatar
-
 Romania
-
 Saudi Arabia
-
 Singapore
-
 Spain
Spain
-
 Sweden
-
 Switzerland
-
 Taiwan
-
 Turkey
-
 United Kingdom
-
 United States
research use only
Cyclopamine (11-Deoxojervine) Hedgehog Signaling Pathway Antagonist
Cat.No.S1146
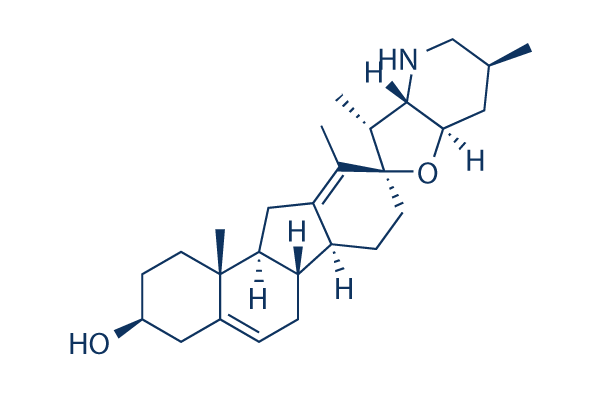
Chemical Structure
Molecular Weight: 411.62
Quality Control
| Related Targets | JAK TGF-beta/Smad Wnt/beta-catenin ERK GSK-3 ROCK PKA Secretase STAT Casein Kinase |
|---|---|
| Other Hedgehog/Smoothened Inhibitors | SAG (Smoothened Agonist) Hydrochloride Purmorphamine GANT 61 (NSC 136476) SAG (Smoothened Agonist) SANT-1 HPI-4 (Ciliobrevin A) BMS-833923 Taladegib (LY2940680) Ciliobrevin D Jervine |
Cell Culture, Treatment & Working Concentration
| Cell Lines | Assay Type | Concentration | Incubation Time | Formulation | Activity Description | PMID |
|---|---|---|---|---|---|---|
| OS-RC-2 | Growth Inhibition Assay | IC50=5.8666 μM | SANGER | |||
| DOHH-2 | Growth Inhibition Assay | IC50=9.35689 μM | SANGER | |||
| no-10 | Growth Inhibition Assay | IC50=9.9039 μM | SANGER | |||
| LS-513 | Growth Inhibition Assay | IC50=11.3547 μM | SANGER | |||
| ALL-PO | Growth Inhibition Assay | IC50=11.7734 μM | SANGER | |||
| 8-MG-BA | Growth Inhibition Assay | IC50=13.1123 μM | SANGER | |||
| RPMI-8402 | Growth Inhibition Assay | IC50=15.8537 μM | SANGER | |||
| EoL-1-cell | Growth Inhibition Assay | IC50=18.5948 μM | SANGER | |||
| NALM-6 | Growth Inhibition Assay | IC50=19.0167 μM | SANGER | |||
| DEL | Growth Inhibition Assay | IC50=20.1471 μM | SANGER | |||
| SR | Growth Inhibition Assay | IC50=23.6715 μM | SANGER | |||
| 697 | Growth Inhibition Assay | IC50=26.6155 μM | SANGER | |||
| COLO-829 | Growth Inhibition Assay | IC50=26.8483 μM | SANGER | |||
| EVSA-T | Growth Inhibition Assay | IC50=27.5561 μM | SANGER | |||
| ATN-1 | Growth Inhibition Assay | IC50=31.2329 μM | SANGER | |||
| L-363 | Growth Inhibition Assay | IC50=31.7461 μM | SANGER | |||
| LAMA-84 | Growth Inhibition Assay | IC50=32.5211 μM | SANGER | |||
| NOS-1 | Growth Inhibition Assay | IC50=34.2956 μM | SANGER | |||
| BB30-HNC | Growth Inhibition Assay | IC50=34.3306 μM | SANGER | |||
| BC-1 | Growth Inhibition Assay | IC50=37.9746 μM | SANGER | |||
| IST-SL2 | Growth Inhibition Assay | IC50=38.224 μM | SANGER | |||
| D-392MG | Growth Inhibition Assay | IC50=40.2215 μM | SANGER | |||
| no-11 | Growth Inhibition Assay | IC50=40.5521 μM | SANGER | |||
| LC4-1 | Growth Inhibition Assay | IC50=40.8716 μM | SANGER | |||
| A388 | Growth Inhibition Assay | IC50=42.5848 μM | SANGER | |||
| NTERA-S-cl-D1 | Growth Inhibition Assay | IC50=42.7074 μM | SANGER | |||
| CESS | Growth Inhibition Assay | IC50=44.2232 μM | SANGER | |||
| RS4-11 | Growth Inhibition Assay | IC50=49.0938 μM | SANGER | |||
| MS-1 | Growth Inhibition Assay | IC50=50.9351 μM | SANGER | |||
| CTV-1 | Growth Inhibition Assay | IC50=51.074 μM | SANGER | |||
| D-502MG | Growth Inhibition Assay | IC50=51.6271 μM | SANGER | |||
| ML-2 | Growth Inhibition Assay | IC50=52.9195 μM | SANGER | |||
| SK-NEP-1 | Growth Inhibition Assay | IC50=53.3923 μM | SANGER | |||
| LOXIMVI | Growth Inhibition Assay | IC50=53.5884 μM | SANGER | |||
| DJM-1 | Growth Inhibition Assay | IC50=56.3391 μM | SANGER | |||
| GI-1 | Growth Inhibition Assay | IC50=56.6149 μM | SANGER | |||
| IST-MES1 | Growth Inhibition Assay | IC50=60.5493 μM | SANGER | |||
| MV-4-11 | Growth Inhibition Assay | IC50=60.6538 μM | SANGER | |||
| OVCAR-4 | Growth Inhibition Assay | IC50=63.5657 μM | SANGER | |||
| KE-37 | Growth Inhibition Assay | IC50=66.2668 μM | SANGER | |||
| D-542MG | Growth Inhibition Assay | IC50=68.4135 μM | SANGER | |||
| MHH-PREB-1 | Growth Inhibition Assay | IC50=72.8441 μM | SANGER | |||
| MRK-nu-1 | Growth Inhibition Assay | IC50=73.4705 μM | SANGER | |||
| D-247MG | Growth Inhibition Assay | IC50=73.5442 μM | SANGER | |||
| OCI-AML2 | Growth Inhibition Assay | IC50=76.9369 μM | SANGER | |||
| LP-1 | Growth Inhibition Assay | IC50=82.8731 μM | SANGER | |||
| HCC1599 | Growth Inhibition Assay | IC50=84.2837 μM | SANGER | |||
| KARPAS-45 | Growth Inhibition Assay | IC50=84.6992 μM | SANGER | |||
| BE-13 | Growth Inhibition Assay | IC50=99.0477 μM | SANGER | |||
| GCIY | Growth Inhibition Assay | IC50=99.0954 μM | SANGER | |||
| BV-173 | Growth Inhibition Assay | IC50=100.325 μM | SANGER | |||
| LB2518-MEL | Growth Inhibition Assay | IC50=100.789 μM | SANGER | |||
| KS-1 | Growth Inhibition Assay | IC50=101.639 μM | SANGER | |||
| MOLT-16 | Growth Inhibition Assay | IC50=104.986 μM | SANGER | |||
| NCI-H1770 | Growth Inhibition Assay | IC50=108.784 μM | SANGER | |||
| NCI-H82 | Growth Inhibition Assay | IC50=110.976 μM | SANGER | |||
| NCCIT | Growth Inhibition Assay | IC50=112.529 μM | SANGER | |||
| KALS-1 | Growth Inhibition Assay | IC50=115.941 μM | SANGER | |||
| LB2241-RCC | Growth Inhibition Assay | IC50=116.679 μM | SANGER | |||
| HH | Growth Inhibition Assay | IC50=117.395 μM | SANGER | |||
| HD-MY-Z | Growth Inhibition Assay | IC50=118.488 μM | SANGER | |||
| EB-3 | Growth Inhibition Assay | IC50=123.094 μM | SANGER | |||
| BL-70 | Growth Inhibition Assay | IC50=123.127 μM | SANGER | |||
| K-562 | Growth Inhibition Assay | IC50=126.245 μM | SANGER | |||
| HT-144 | Growth Inhibition Assay | IC50=133.164 μM | SANGER | |||
| PF-382 | Growth Inhibition Assay | IC50=134.361 μM | SANGER | |||
| RPMI-8226 | Growth Inhibition Assay | IC50=135.045 μM | SANGER | |||
| NCI-H1355 | Growth Inhibition Assay | IC50=135.587 μM | SANGER | |||
| LXF-289 | Growth Inhibition Assay | IC50=139.781 μM | SANGER | |||
| NCI-H69 | Growth Inhibition Assay | IC50=142.932 μM | SANGER | |||
| SK-MEL-1 | Growth Inhibition Assay | IC50=147.13 μM | SANGER | |||
| KARPAS-299 | Growth Inhibition Assay | IC50=149.12 μM | SANGER | |||
| GB-1 | Growth Inhibition Assay | IC50=149.322 μM | SANGER | |||
| CMK | Growth Inhibition Assay | IC50=149.515 μM | SANGER | |||
| MPP-89 | Growth Inhibition Assay | IC50=156.035 μM | SANGER | |||
| KU812 | Growth Inhibition Assay | IC50=161.902 μM | SANGER | |||
| REH | Growth Inhibition Assay | IC50=162.125 μM | SANGER | |||
| NEC8 | Growth Inhibition Assay | IC50=165.026 μM | SANGER | |||
| KP-N-YS | Growth Inhibition Assay | IC50=168.395 μM | SANGER | |||
| Ramos-2G6-4C10 | Growth Inhibition Assay | IC50=169.915 μM | SANGER | |||
| Becker | Growth Inhibition Assay | IC50=174.18 μM | SANGER | |||
| LB647-SCLC | Growth Inhibition Assay | IC50=175.845 μM | SANGER | |||
| LU-139 | Growth Inhibition Assay | IC50=178.019 μM | SANGER | |||
| QIMR-WIL | Growth Inhibition Assay | IC50=179.646 μM | SANGER | |||
| NCI-H1395 | Growth Inhibition Assay | IC50=179.996 μM | SANGER | |||
| NOMO-1 | Growth Inhibition Assay | IC50=182.85 μM | SANGER | |||
| GI-ME-N | Growth Inhibition Assay | IC50=187.969 μM | SANGER | |||
| KMS-12-PE | Growth Inhibition Assay | IC50=189.273 μM | SANGER | |||
| Daudi | Growth Inhibition Assay | IC50=191.128 μM | SANGER | |||
| LB996-RCC | Growth Inhibition Assay | IC50=191.699 μM | SANGER | |||
| NCI-H2107 | Growth Inhibition Assay | IC50=193.739 μM | SANGER | |||
| SK-PN-DW | Growth Inhibition Assay | IC50=194.719 μM | SANGER | |||
| MC-CAR | Growth Inhibition Assay | IC50=202.253 μM | SANGER | |||
| SNB75 | Growth Inhibition Assay | IC50=221.94 μM | SANGER | |||
| ES4 | Growth Inhibition Assay | IC50=223.783 μM | SANGER | |||
| KARPAS-422 | Growth Inhibition Assay | IC50=228.352 μM | SANGER | |||
| NCI-H1648 | Growth Inhibition Assay | IC50=229.489 μM | SANGER | |||
| ES6 | Growth Inhibition Assay | IC50=239.43 μM | SANGER | |||
| KNS-81-FD | Growth Inhibition Assay | IC50=241.197 μM | SANGER | |||
| JAR | Growth Inhibition Assay | IC50=256.225 μM | SANGER | |||
| NB1 | Growth Inhibition Assay | IC50=260.516 μM | SANGER | |||
| D-336MG | Growth Inhibition Assay | IC50=260.698 μM | SANGER | |||
| BC-3 | Growth Inhibition Assay | IC50=265.178 μM | SANGER | |||
| HCC2218 | Growth Inhibition Assay | IC50=266.415 μM | SANGER | |||
| TE-9 | Growth Inhibition Assay | IC50=266.627 μM | SANGER | |||
| LB1047-RCC | Growth Inhibition Assay | IC50=266.753 μM | SANGER | |||
| CTB-1 | Growth Inhibition Assay | IC50=269.973 μM | SANGER | |||
| NB7 | Growth Inhibition Assay | IC50=271 μM | SANGER | |||
| ST486 | Growth Inhibition Assay | IC50=277.412 μM | SANGER | |||
| HCC1187 | Growth Inhibition Assay | IC50=282.811 μM | SANGER | |||
| NCI-SNU-16 | Growth Inhibition Assay | IC50=284.248 μM | SANGER | |||
| COR-L279 | Growth Inhibition Assay | IC50=291.584 μM | SANGER | |||
| ES8 | Growth Inhibition Assay | IC50=294.182 μM | SANGER | |||
| U-698-M | Growth Inhibition Assay | IC50=298.243 μM | SANGER | |||
| HEL | Growth Inhibition Assay | IC50=309.149 μM | SANGER | |||
| KINGS-1 | Growth Inhibition Assay | IC50=310.674 μM | SANGER | |||
| KY821 | Growth Inhibition Assay | IC50=336.595 μM | SANGER | |||
| MZ1-PC | Growth Inhibition Assay | IC50=345.618 μM | SANGER | |||
| LS-411N | Growth Inhibition Assay | IC50=354.66 μM | SANGER | |||
| SIG-M5 | Growth Inhibition Assay | IC50=359.782 μM | SANGER | |||
| HT | Growth Inhibition Assay | IC50=367.711 μM | SANGER | |||
| HC-1 | Growth Inhibition Assay | IC50=367.787 μM | SANGER | |||
| NCI-H1694 | Growth Inhibition Assay | IC50=372.934 μM | SANGER | |||
| BB65-RCC | Growth Inhibition Assay | IC50=376.245 μM | SANGER | |||
| HAL-01 | Growth Inhibition Assay | IC50=379.838 μM | SANGER | |||
| ARH-77 | Growth Inhibition Assay | IC50=394.008 μM | SANGER | |||
| MZ7-mel | Growth Inhibition Assay | IC50=397.233 μM | SANGER | |||
| SIMA | Growth Inhibition Assay | IC50=403.933 μM | SANGER | |||
| DG-75 | Growth Inhibition Assay | IC50=415.698 μM | SANGER | |||
| HUTU-80 | Growth Inhibition Assay | IC50=419.185 μM | SANGER | |||
| KNS-42 | Growth Inhibition Assay | IC50=425.815 μM | SANGER | |||
| SH-4 | Growth Inhibition Assay | IC50=427.565 μM | SANGER | |||
| L-540 | Growth Inhibition Assay | IC50=431.031 μM | SANGER | |||
| NB10 | Growth Inhibition Assay | IC50=441.234 μM | SANGER | |||
| ES1 | Growth Inhibition Assay | IC50=452.753 μM | SANGER | |||
| KMOE-2 | Growth Inhibition Assay | IC50=456.711 μM | SANGER | |||
| MC116 | Growth Inhibition Assay | IC50=458.116 μM | SANGER | |||
| RCC10RGB | Growth Inhibition Assay | IC50=460.005 μM | SANGER | |||
| RL95-2 | Growth Inhibition Assay | IC50=460.237 μM | SANGER | |||
| Raji | Growth Inhibition Assay | IC50=468.143 μM | SANGER | |||
| CAS-1 | Growth Inhibition Assay | IC50=472.073 μM | SANGER | |||
| Calu-6 | Growth Inhibition Assay | IC50=475.265 μM | SANGER | |||
| KG-1 | Growth Inhibition Assay | IC50=478.44 μM | SANGER | |||
| LB771-HNC | Growth Inhibition Assay | IC50=482.232 μM | SANGER | |||
| ACN | Growth Inhibition Assay | IC50=493.599 μM | SANGER | |||
| KM12 | Growth Inhibition Assay | IC50=496.589 μM | SANGER | |||
| U2OS | Function assay | Binding affinity to wild type Smo expressed in U2OS cells by scintillation counting, Kd = 0.0124 μM. | 23063522 | |||
| U2OS | Function assay | 2 hrs | Displacement of [3H]cyclopamine from wild type Smo expressed in U2OS cells after 2 hrs by scintillation counting, Ki = 0.0127 μM. | 23063522 | ||
| TM3 | Function assay | 48 hrs | Inhibition of Hedgehog signaling pathway in mouse TM3 cells bearing pTA-8xGli-Luc reporter construct assessed as transcriptional modulation of Gli after 48 hrs by luciferase assay, IC50 = 0.046 μM. | 19091559 | ||
| HCC827 | Function assay | Displacement of [3H]-cyclopamine from SMO V404M mutant in gefitinib resistant human HCC827 cells by scintillation counting, Ki = 0.051 μM. | 28787156 | |||
| HEK293 | Function assay | 2 hrs | Displacement of BODIPY-labelled cyclopamine from human Smo receptor expressed in HEK293 cells after 2 hrs by fluorescence microscopy, IC50 = 0.064 μM. | 22268551 | ||
| Shh Light2 | Function assay | 30 hrs | Inhibition of hedgehog signaling pathway in mouse Shh Light2 cells assessed as inhibition of sonic hedgehog-induced GLI1-mediated transcriptional activity measured after 30 hrs by dual luciferase reporter gene assay, IC50 = 0.0741 μM. | 27567371 | ||
| U2OS | Function assay | Binding affinity to Smo D473H mutant expressed in U2OS cells by scintillation counting, Kd = 0.116 μM. | 23063522 | |||
| DaOY | Function assay | 48 hrs | Inhibition of Hedgehog signaling in human DaOY cells assessed as downregulation of Gli1 mRNA expression after 48 hrs by RT-PCR analysis, IC50 = 0.16 μM. | 24900716 | ||
| U2OS | Function assay | 2 hrs | Displacement of [3H]cyclopamine from Smo D473H mutant expressed in U2OS cells after 2 hrs by scintillation counting, Ki = 0.232 μM. | 23063522 | ||
| CHO | Function assay | Antagonist activity at human Smo receptor expressed in CHO cells by [3H]Hh-Ag binding assay, IC50 = 0.28 μM. | 19091559 | |||
| Shh Light2 | Function assay | 40 hrs | Inhibition of SHH pathway in mouse Shh Light2 cells after 40 hrs by Gli-dependent luciferase reporter gene assay, IC50 = 0.3 μM. | 21592788 | ||
| Shh-light2 | Function assay | Inhibition of Smo-mediated Hh signaling in human Shh-light2 cells by luciferase reporter gene assay, IC50 = 0.3 μM. | 22268551 | |||
| M210B4 | Function assay | 24 hrs | Inhibition of Hedgehog signaling in mouse M210B4 cells assessed as downregulation of Ptch mRNA expression after 24 hrs by RT-PCR analysis, IC50 = 0.43 μM. | 24900716 | ||
| Shh-Light 2 | Function assay | 2 days | Antagonist activity at Smo in mouse Shh-Light 2 cells assessed as inhibition of Shh-induced Gli1-reporter activity after 2 days by dual-luciferase reporter gene method, IC50 = 0.484 μM. | 23063522 | ||
| Shh Light2 | Function assay | Inhibition of SHH in mouse Shh Light2 cells by GLI-responsive firefly luciferase reporter gene assay, EC50 = 0.5 μM. | 19309080 | |||
| C3H10T1/2 | Function assay | Inhibition of N-terminal SHH activated pathway in mouse C3H10T1/2 cells assessed as SAG-induced cell differentiation by alkaline phosphatase assay, IC50 = 0.6 μM. | 21592788 | |||
| C3H10T1/2 | Function assay | 6 hrs | Inhibition of SAG-induced differentiation of mouse mesenchymal pluripotent C3H10T1/2 cells to alkaline phosphatase positive oeseoblasts after 6 hrs, IC50 = 0.62 μM. | 22268551 | ||
| ASZ001 | Function assay | 48 hrs | Inhibition of Hedgehog signaling in mouse ASZ001 cells assessed as downregulation of Gli1 mRNA expression after 48 hrs by RT-PCR analysis, IC50 = 0.66 μM. | 24900716 | ||
| M210B4 | Function assay | 24 hrs | Inhibition of Hedgehog signaling in mouse M210B4 cells assessed as downregulation of Gli1 mRNA expression after 24 hrs by RT-PCR analysis, IC50 = 0.8 μM. | 24900716 | ||
| medulloblastoma cells | Antiproliferative assay | Antiproliferative activity against mouse medulloblastoma cells harboring heterozygous ptch1 gene by MTT assay, EC50 = 1 μM. | 17417631 | |||
| CHO | Function assay | Antagonist activity at mouse Smo receptor expressed in CHO cells by [3H]Hh-Ag binding assay, IC50 = 1.2 μM. | 19091559 | |||
| Shh-Light2 | Function assay | 48 hrs | Inhibition of SHH in mouse Shh-Light2 cells after 48 hrs by Gli1 reporter gene assay in presence of SAG, IC50 = 1.312 μM. | 19541490 | ||
| MEF | Function assay | Inhibition of Smo in mouse Ptch-deficient MEF cells assessed as inhibition of Shh-induced Gli1 transcriptional activity, IC50 = 1.5 μM. | 23074541 | |||
| MEF | Function assay | 30 hrs | Inhibition of Smo in mouse Ptch-deficient MEF cells assessed as inhibition of Shh-induced Gli-responsive betagalactosidase activity after 30 hrs by BetaGLo assay, IC50 = 1.9 μM. | 23074541 | ||
| neural precursor cells | Antiproliferative assay | Antiproliferative activity against mouse neural precursor cells by colony formation assay, EC50 = 13.44 μM. | 17417631 | |||
| U87 | Cytotoxicity assay | Cytotoxicity against human U87 cells assessed as viability in presence of beta glucuronidase, IC50 = 15.5 μM. | 20116904 | |||
| U87MG | Antiproliferative assay | 72 hrs | Antiproliferative activity against human U87MG cells after 72 hrs by MTS assay, IC50 = 22.5 μM. | 22226657 | ||
| A549 | Anticancer assay | Anticancer activity against human A549 cells by MTS assay, IC50 = 49 μM. | 18221872 | |||
| DU145 | Growth inhibition assay | 5 uM | 96 hrs | Growth inhibition of human DU145 cells at 5 uM after 96 hrs | 18249125 | |
| DU145 | Growth inhibition assay | 10 uM | 96 hrs | Growth inhibition of human DU145 cells at 10 uM after 96 hrs | 18249125 | |
| HEK293 | Function assay | Inhibition of beta galactosidase in HEK293 cells | 17494766 | |||
| 22Rv | Function assay | Reduction of expression of PTCH mRNA in human 22Rv cells | 17494766 | |||
| PANC1 | Function assay | 0.2 uM | 24 hrs | Inhibition of Hh/GLI1-mediated PTCH mRNA expression in human PANC1 cells at 0.2 uM after 24 hrs by RT-PCR | 20450170 | |
| PANC1 | Function assay | 0.4 uM | 24 hrs | Inhibition of Hh/GLI1-mediated PTCH mRNA expression in human PANC1 cells at 0.4 uM after 24 hrs by RT-PCR | 20450170 | |
| Shh Light2 | Function assay | 6.25 uM | 30 hrs | Inhibition of N-palmitoylated Shh in mouse Shh Light2 cells at 6.25 uM after 30 hrs by firefly luciferase reporter gene assay | 19151731 | |
| U87MG | Function assay | 10 uM | 4 hrs | Inhibition of Hedgehog signaling pathway in human U87MG cells assessed as down regulation of Gli1 at 10 uM after 4 hrs by RT-PCR analysis | 22226657 | |
| HEK293 | Function assay | 5 uM | 10 hrs | Displacement of BODIPY-cyclopamine from human Smo expressed in HEK293 cells at 5 uM measured after 10 hrs by DAPI staining based fluorescence microscopic assay | 27736063 | |
| HEK293 | Function assay | 5 uM | 10 hrs | Displacement of BODIPY-cyclopamine from human Smo expressed in HEK293 cells at 5 uM measured after 10 hrs by FACS analysis | 27736063 | |
| C3H10T1/2 | Function assay | 55.5 to 4500 nM | Competitive inhibition of Smo in mouse C3H10T1/2 cells assessed as inhibition of SAG-induced Gli1 transcriptional activity at 55.5 to 4500 nM by qPCR analysis | 23074541 | ||
| U2OS | Function assay | 5 uM | 6 hrs | Antagonist activity at chimeric Smo 633 mutant expressed in U2OS cells coexpressing beta arrestin2-GFP assessed as inhibition of intracellular beta arrestin2-GFP aggregate formation at 5 uM after 6 hrs by confocal microscopy | 23063522 | |
| Click to View More Cell Line Experimental Data | ||||||
Solubility
|
In vitro |
Ethanol : 28 mg/mL
DMSO
: Insoluble
Water : Insoluble |
Molarity Calculator
|
In vivo |
|||||
In vivo Formulation Calculator (Clear solution)
Step 1: Enter information below (Recommended: An additional animal making an allowance for loss during the experiment)
Step 2: Enter the in vivo formulation (This is only the calculator, not formulation. Please contact us first if there is no in vivo formulation at the solubility Section.)
Calculation results:
Working concentration: mg/ml;
Method for preparing DMSO master liquid: mg drug pre-dissolved in μL DMSO ( Master liquid concentration mg/mL, Please contact us first if the concentration exceeds the DMSO solubility of the batch of drug. )
Method for preparing in vivo formulation: Take μL DMSO master liquid, next addμL PEG300, mix and clarify, next addμL Tween 80, mix and clarify, next add μL ddH2O, mix and clarify.
Method for preparing in vivo formulation: Take μL DMSO master liquid, next add μL Corn oil, mix and clarify.
Note: 1. Please make sure the liquid is clear before adding the next solvent.
2. Be sure to add the solvent(s) in order. You must ensure that the solution obtained, in the previous addition, is a clear solution before proceeding to add the next solvent. Physical methods such
as vortex, ultrasound or hot water bath can be used to aid dissolving.
Chemical Information, Storage & Stability
| Molecular Weight | 411.62 | Formula | C27H41NO2 |
Storage (From the date of receipt) | |
|---|---|---|---|---|---|
| CAS No. | 4449-51-8 | Download SDF | Storage of Stock Solutions |
|
|
| Synonyms | 11-deoxojervine | Smiles | CC1CC2C(C(C3(O2)CCC4C5CC=C6CC(CCC6(C5CC4=C3C)C)O)C)NC1 | ||
Mechanism of Action
| Targets/IC50/Ki |
Smoothened
(TM3Hh12 cells) 46 nM
|
|---|---|
| In vitro |
Cyclopamine inhibits the Hedgehog signaling pathway with an IC50 of 46 nM, and blocks the activity of human Smo receptor expressed in CHO-K1 cells in [3H]Hh-Ag binding assay with an IC50 of 280 nM. This compound significantly inhibits Hedgehog pathway activity in a dose-dependent manner in gut-derived tumor cell lines expressing Patched (PTCH) mRNA, and induces growth inhibition of those tumor cell lines by 75-95% at the concentration of 3 μM, but ineffective towards the colon tumor cells without PTCH mRNA expression, suggesting the effects of this chemical treatment are Hedgehog pathway related rather than generally cytotoxic. By blocking Hedgehog signaling through direct interaction with Smo, it (10 μM) inhibits the proliferation of SMOhigh Cyclopamine-responsive cell lines L3.6sl and Panc 05.04 by 75-80%, and increases the apoptosis by 2.5- to 3.5-fold, without affecting the BxPC3-SMOlow cell line. This treatment significantly decreases of Snail mRNA and increasea E-cadherin transcripts in the E3LZ10.7 cell line. Independent of inhibition of cell growth, it significantly inhibits the invasive phenotype of Hedgehog-dependent L3.6pl cells, causing a >500-fold reduction in the number of transmigrating cells, but not that of the Hedgehog-independent cell line Panc-1.
|
| Kinase Assay |
Hedgehog cell assay
|
|
This assay measures the end stage of the Hh signaling pathway, that is, the transcriptional modulation of Gli, using Luciferase as readout (Gli-Luc assay). Cyclopamine is prepared for assay by serial dilution in DMSO and then added to empty assay plates. TM3Hh12 cells (TM3 cells containing Hh-responsive reporter gene construct pTA-8xGli-Luc) are resuspended in F12 Ham's/DMEM (1:1) containing 5% FBS and 15 mM Hepes pH 7.3, added to assay plates and incubated with this compound for approximately 30 minutes at 37 °C in 5% CO2. 1 nM Hh-Ag 1.5 is then added to assay plates and incubated at 37 °C in the presence of 5% CO2. After 48 hours, either Bright-Glo or MTS reagent is added to the assay plates and luminescence or absorbance at 492 nm is determined. IC50 value, defined as the inflection point of the logistic curve, is determined by non-linear regression of the Gli-driven luciferase luminescence or absorbance signal from MTS assay vs log10 (concentration) of this chemical using the R statistical software pack
|
|
| In vivo |
Administration of Cyclopamine at dose of 50 mg/kg/day for 22 days eradicates the HUCCT1 xenografts in mice with no obvious adverse effects. This compound treatment at dose of 1.2 mg for 7 days induces significant apoptosis of tumor cells and decreases the tumor mass by 50-60% in Panc 05.04- and L3.6sl-derived tumors, respectively, but not in the BxPC3-SMOlow tumors. [3] Administration of this chemical alone profoundly inhibits tumor metastases in xenografts of E3LZ10.7 and L3.6pl, and completely abrogates metastases when in combination of gemcitabine.
|
References |
|
Applications
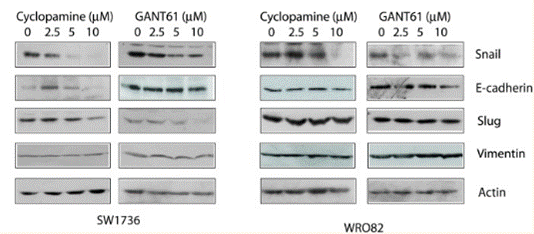
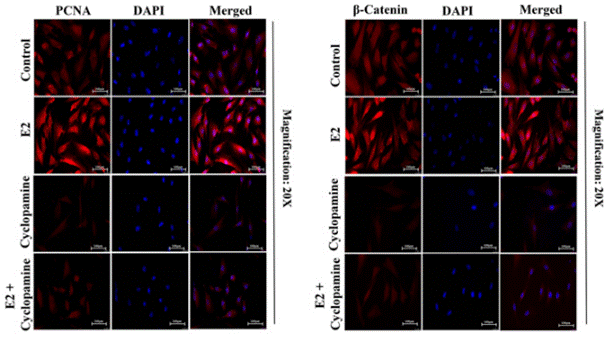
| Methods | Biomarkers | Images | PMID |
|---|---|---|---|
| Western blot | Snail / E-cadherin / Slug / Vimentin Gli1 / TGF-β1 / CXCR4 NF-κB / Cyclin D1 / MMP2 / MMP9 |
|
26859575 |
| Immunofluorescence | PCNA / β-catenin Vimentin |
|
28747625 |
Tech Support
Tel: +1-832-582-8158 Ext:3
If you have any other enquiries, please leave a message.
Frequently Asked Questions
Question 1:
How to reconstitute it for in vivo use in mice?
Answer:
One paper dissolved this compound in DMSO, and diluted it in saline: Berman DM, et al. Nature, 2003, 425(6960), 846-851. Alternatively, you can try this vehicle: 10% DMSO+30% PEG 300+5% Tween 80+ddH2O for P.O. When preparing the solution, please dissolve it in DMSO clearly first. Then add PEG300 and Tween, after they mixed well, dilute with water.
Signaling Pathway Map
Products are for research use only. Not for human use. We do not sell to patients.
©Copyright 2013 Selleck Chemicals. All Rights Reserved.