
Why does Rapamycin treatment cause an apparent drop in MTT signal without inducing cell death?
Quick Answer
Recommended ApproachValidate drug effects using multiparametric orthogonal assays—combining LDH release, direct cell counting, and caspase activation with MTT—to distinguish genuine cell death from metabolic deceleration.
Common CausesThe MTT signal dropped because Rapamycin inhibits mTORC1/HIF-1α-driven glycolysis and induces cytostatic G1 arrest, drastically reducing cellular NAD(P)H reducing equivalents and cell division without causing cytotoxic cell membrane lysis.
How Should It Be Done Correctly?
Copy code to add this image to your page Copy Code
Multiparametric Assay Selection for Disentangling Cytostasis from Cytotoxicity
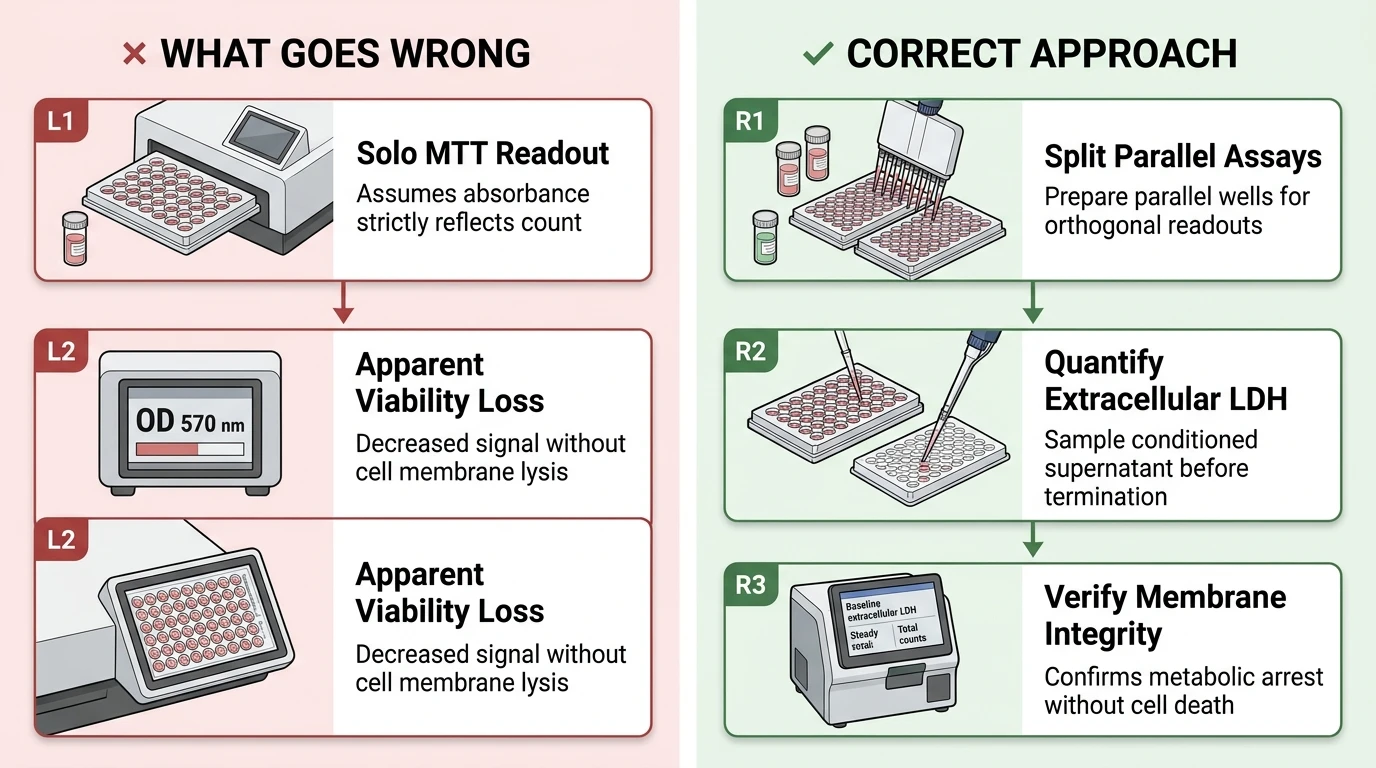
When evaluating mTOR inhibitors such as Rapamycin, relying solely on tetrazolium salt reduction (MTT or XTT) creates an artifactual conflation between decreased metabolic rate, cytostatic cell cycle arrest, and true cell death [1, 2]. To distinguish genuine cytotoxic cell killing from metabolic suppression and anti-proliferative arrest, orthogonal viability, cytotoxicity, and proliferation readouts must be deployed concurrently [1, 2, 3].
Recommended multi-assay validation panel to decouple metabolic modulation from cell death under mTOR inhibition.
Systematic Protocol for Validating Rapamycin Efficacy Without Viability Artifacts
- Preparation of Rapamycin Stock and Treatment Dilutions: Reconstitute Rapamycin powder in anhydrous DMSO to a recommended stock concentration of 10 mM. Aliquot into single-use amber microcentrifuge tubes to avoid freeze-thaw cycles and store at -80 °C (stable for 1 year) or -20 °C (stable for 1 month). On the day of dosing, perform serial working dilutions in pre-warmed complete culture medium, ensuring the final vehicle DMSO concentration across all treatment and control wells is strictly ≤0.1% (v/v) to avoid solvent-mediated baseline shifts.
- Parallel Dual-Readout Well Configuration: Plate cells at an empirically verified density that maintains logarithmic growth throughout the intended incubation period (e.g., 24 to 72 hours) [5]. Arrange duplicate plates or dedicate parallel wells for both metabolic/colorimetric assays and orthogonal membrane integrity assays [2].
- Evaluation of Membrane Lysis via LDH Supernatant Sampling: Before adding MTT solution or terminating cultures, withdraw conditioned culture supernatant at 24, 48, or 72 hours and quantify released extracellular LDH relative to Triton X-100 total-lysed controls [2]. A drop in metabolic reduction accompanied by baseline extracellular LDH levels confirms that cell membrane integrity remains intact despite reduced formazan formation [2].
- Orthogonal Verification of Cell Number and Apoptosis Markers: Complement metabolic readouts with direct cell counting (or crystal violet biomass staining) and quantify cleaved caspase-3 activation or Annexin V/PI staining to verify whether the agent is cytostatic or cytotoxic [2, 3]. Where necessary, evaluate cell cycle distribution (G1/sub-G1 analysis) by propidium iodide flow cytometry to benchmark cell cycle arrest [4, 5].
| Assay Type | Target Biomarker / Mechanism | Readout Under Rapamycin | Interpretation vs. True Cytotoxicity |
|---|---|---|---|
| MTT / XTT Assay | NAD(P)H-dependent dehydrogenase reduction | Dose-dependent signal decrease [1, 2, 4] | Reflects reduced glycolytic flux and cell cycle arrest, not cell lysis [1, 5] |
| LDH Release Assay | Membrane integrity / extracellular lactate dehydrogenase | Unchanged or baseline LDH release [2] | Confirms absence of cell membrane permeabilization and non-toxicity [1, 2] |
| Cell Counting / Trypan Blue | Intact plasma membrane exclusion / total cell count | Signal plateau without dead cell accumulation [1, 2] | Identifies cytostatic antiproliferative arrest rather than cytocidal loss [1, 3] |
| Annexin V / PI Flow Cytometry | Phosphatidylserine exposure & DNA dye permeability | Stable low apoptotic/necrotic fraction in non-sensitive lines [3] | Direct measurement of apoptosis; differentiates cytostasis from apoptosis [3, 4] |
| EdU / Ki-67 Incorporation | Active de novo DNA synthesis (S-phase entry) | Significant reduction in EdU+ cells / G1 arrest [3, 4, 5] | Quantifies cell cycle deceleration independent of cellular redox state [4, 5] |
| Glycolytic Flux / ATP Analysis | Glucose consumption, lactate, and cellular ATP pool | Marked decrease in glucose uptake and lactate release [5] | Confirms metabolic reprogramming mediated by mTOR/HIF-1α axis [5, 6] |
What Went Wrong?
Overreliance on Tetrazolium Reduction as a Pure Cell Count Metric
The fundamental operational error was assuming that the MTT signal is strictly proportional to absolute viable cell count across perturbed metabolic states [1, 5]. Investigators frequently equate a 30% to 50% decrease in optical density (OD 570 nm) directly with 30% to 50% cell death [4]. When handling metabolic modulators, tetrazolium conversion reflects mitochondrial and cytosolic dehydrogenase enzyme turnover rather than physical cell presence [1, 5]. Overlooking non-metabolic orthogonal viability controls creates the false impression of widespread cellular lethality where only bioenergetic throttling has occurred [1, 2, 3].
Conflation of Bioenergetic Deceleration with Cytotoxicity
The proximate cause of the apparent signal loss without loss of cell numbers is the dual physiological consequence of mTOR inhibition: a steep downregulation of intracellular redox cofactors (NADH and NADPH) per cell, coupled with proliferation arrest [1, 3, 5]. MTT tetrazolium salts are cleaved into insoluble purple formazan predominantly by NAD(P)H-dependent cellular oxidoreductases and glycolytic intermediates [1, 5]. Because Rapamycin downregulates the cellular metabolic engine, individual surviving cells convert significantly less substrate per unit time [5]. Concurrently, Rapamycin induces G1-phase cell cycle arrest, arresting population doubling while control untreated wells continue exponential expansion [4, 5]. Together, diminished per-cell dehydrogenase activity and fewer cell doublings cause the total MTT absorbance to plummet dramatically, even when zero membrane lysis or apoptosis occurs [1, 2, 3].
Downregulation of the mTORC1/HIF-1α Glycolytic Axis
Mechanistically, Rapamycin binds intracellularly to FKBP12 to form a gain-of-function complex that allosterically inhibits mechanistic target of rapamycin complex 1 (mTORC1) [5, 6, 7]. mTORC1 is the master regulator of cellular anabolism, controlling protein synthesis, ribosome biogenesis, and nutrient utilization [3, 5, 6]. Inhibition of mTORC1 suppresses the phosphorylation of its canonical downstream effectors, p70S6 kinase (p70S6K) and eukaryotic translation initiation factor 4E-binding protein 1 (4E-BP1) [2, 3, 5]. Hypo-phosphorylated 4E-BP1 sequesters eIF4E, shutting down cap-dependent translation of oncogenic and metabolic drivers, particularly hypoxia-inducible factor 1-alpha (HIF-1α) [3, 5].
Downregulation of HIF-1α protein expression leads to immediate transcriptional suppression of key glycolytic enzymes and glucose transporters, including pyruvate dehydrogenase kinase 1 (PDK1) and lactate dehydrogenase A (LDHA) [5]. Consequently, cells exhibit marked reductions in glucose consumption, lactate extrusion, and intracellular ATP and NADH/NADPH generation [5, 6]. Because the enzymatic reduction of MTT tetrazolium depends on continuous reducing equivalents supplied by glycolysis and mitochondrial matrix dehydrogenases, this metabolic shutoff directly collapses the rate of formazan precipitation [1, 5]. Furthermore, through suppression of cyclin-dependent kinases (such as CDK2) and cyclin D1 translation, Rapamycin triggers G1 cell cycle arrest, stabilizing cell count without triggering cleaved caspase-3 or membrane permeabilization in resistant or normal cell types [1, 2, 3, 5].
How Can I Avoid This in Future Experiments?
To prevent misleading viability assessments when screening kinase inhibitors or metabolic drugs, never rely on a single metabolic reduction assay (such as MTT, MTS, XTT, or Resazurin) as the sole indicator of cytotoxicity. Always incorporate an orthogonal, non-metabolic assay that directly evaluates plasma membrane integrity (such as LDH release or SYTOX green exclusion) or physical cell count (such as Hoechst nuclear enumeration or crystal violet staining) to establish a baseline before attributing signal loss to cell death [2, 3].
In addition, profile early molecular markers of apoptosis—including cleaved caspase-3 or poly(ADP-ribose) polymerase (PARP) cleavage—by Western blotting alongside cell cycle profiling [2, 3, 4]. If cell numbers remain stable, LDH release is baseline, and caspase activation is absent despite a low tetrazolium signal, the compound should correctly be classified as cytostatic and metabolic-inhibitory rather than cytotoxic [1, 2, 3].
References
- [1]Asani B, et al. BMC ophthalmology. 2022 Mar;22(1):138.[IF: 2.0]
- [2]Lisi L, et al. International journal of molecular sciences. 2023 Jun;24(12).[IF: 4.9]
- [3]Ruffolo B, et al. Cancers. 2025 Aug;17(15).[IF: 4.8]
- [4]Arjmand F, et al. BioImpacts : BI. 2024 Jan;14(4):28870.[IF: 2.2]
- [5]Pu BP, et al. World journal of gastrointestinal oncology. 2025 Sep;17(9):109378.[IF: 2.7]
- [6]Queiroz LAD, et al. Frontiers in immunology. 2025 Jan;16:1682406.[IF: 7.0]
- [7]Lee S, et al. iScience. 2023 Mar;26(3):106233.[IF: 4.6]