


A Decade of Regulatory Evolution (2005–2015)
The regulatory landscape for cardiac safety has shifted significantly over the past ten years. Starting with the 2005 ICH E14 guideline, which placed the relationship between drug concentration and QTc under active investigation, we have moved toward a more integrated approach. By 2008, the FDA established that C-QTc modeling could predict QT effects at unstudied doses and evaluate assay sensitivity. The 2014 and 2015 updates (ICH E14 Q&A R2 & R3) finally validated this as a primary method for risk classification, provided model pre-specification and high-quality data are present. For researchers utilizing Antineoplastic and Immunosuppressive Antibiotics, these models are indispensable for assessing proarrhythmic risks in patients with complex pharmacokinetic profiles.
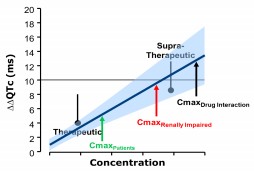
Regulatory Impact and Case Studies
C-QTc modeling provides clinically relevant perspectives beyond the standard Intersection-Union Test (IUT). For example, it allowed for the projection of QTc prolongation in elderly and renally impaired patients for Anzemet (dolasetron) and characterized risks in poor metabolizers for Sertindole. In the case of Zofran (ondansetron), modeling directly informed the decision to limit intravenous doses to 16 mg.
Concordance and Statistical Performance
Analysis of 204 TQT studies showed that linear C-QTc models have excellent sensitivity and specificity. Specifically, in 165 E14-negative studies, the C-QTc slope correctly predicted the outcome in 86% of cases. The landmark IQ/CSRC Study further proved that small dose-escalation studies (using only 9 subjects per drug) could effectively detect the QT effects of known drugs like Moxifloxacin and Quinine around the regulatory threshold.
The New Paradigm: Phase 1 Data as Definitive Assessment
According to ICH E14 Q&A (R3), C-QTc analysis can now serve as the primary basis for decisions. To conclude that expanded ECG safety evaluation is not needed, the upper bound of the 90% CI for the QTc effect must be <10 ms at the highest clinically relevant exposure. Data can be sourced from:
- First-in-human (FIH) studies (SAD/MAD).
- Clinical pharmacology studies with high-quality ECG recording.
- Studies where exposure margins are 3-5 fold higher than therapeutic levels (substituting for a positive control).
Implementation and Best Practices
Successful implementation requires a pre-specified modeling plan. Goodness-of-fit plots must show minimal bias regarding concentration, dose, and time. However, certain "Difficult Drugs" still require caution, including:
- Drugs with significant heart rate effects or QT/RR hysteresis.
- Compounds with multiple active metabolites that inhibit the hERG channel.
- Extended-release formulations where narrow concentration ranges might lead to slope inaccuracies.
Conclusion
Concentration-QTc analysis is no longer just a supportive investigation; it is a validated primary analysis tool. This paradigm shift, supported by a decade of FDA experience and the IQ/CSRC results, allows for safer and more efficient drug development by characterizing cardiac risk earlier in the clinical timeline.
References
- Florian et al. J Clin Pharmacol. 2011;51:1152-1162.
- Zhang et al. Therapeutic Innovation & Regulatory Science 2015.
- Darpo et al. Clin Pharmacol Ther. 2015 Apr;97(4):326-35.