-
 Australia
-
 Austria
-
 Belgium
-
 Brazil
-
 Canada
-
 China
China
-
 Czech Republic
-
 Denmark
-
 Finland
-
 France
-
 Germany
-
 Greece
-
 Hong Kong
-
 Hungary
-
 Iceland
-
 India
India
-
 Ireland
-
 Israel
-
 Italy
Italy
-
 Japan
Japan
-
 Korea
Korea
-
 Luxembourg
-
 Malaysia
-
 Netherlands
-
 New Zealand
-
 Norway
-
 Poland
-
 Qatar
Qatar
-
 Romania
-
 Saudi Arabia
-
 Singapore
-
 Spain
Spain
-
 Sweden
-
 Switzerland
-
 Taiwan
-
 Turkey
-
 United Kingdom
-
 United States
research use only
GSK-LSD1 2HCl Histone Demethylase inhibitor
Cat.No.S7574
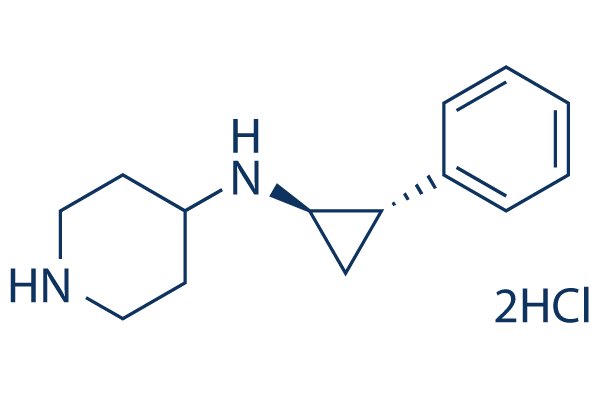
Chemical Structure
Molecular Weight: 289.24
Quality Control
| Related Targets | HDAC JAK BET Histone Methyltransferase PKC PARP HIF PRMT EZH2 AMPK |
|---|---|
| Other Histone Demethylase Inhibitors | GSK-J4 Hydrochloride SP2509 JIB-04 Iadademstat (ORY-1001) Dihydrochloride CPI-455 HCl OG-L002 IOX1 GSK J1 ML324 CP2 |
Cell Culture, Treatment & Working Concentration
| Cell Lines | Assay Type | Concentration | Incubation Time | Formulation | Activity Description | PMID |
|---|---|---|---|---|---|---|
| A549 | Function assay | 10 uM | 1 hr | Binding affinity to LSD1 in human A549 cells assessed as increase in stability of cellular LSD1 protein at 10 uM pre-incubated for 1 hr followed by heating at 49 degC for 3 mins by Western blot-based CESTA | 30780087 | |
| A549 | Function assay | 10 uM | 1 hr | Binding affinity to LSD1 in human A549 cells assessed as increase in stability of cellular LSD1 protein at 10 uM pre-incubated for 1 hr followed by heating at 52 degC for 3 mins by Western blot-based CESTA | 30780087 | |
| A549 | Function assay | 96 hrs | Down regulation of snail levels in human A549 cells up to 16 uM after 96 hrs by Western blot analysis | 30780087 | ||
| A549 | Function assay | 96 hrs | Down regulation of N-cadherin levels in human A549 cells up to 16 uM after 96 hrs by Western blot analysis | 30780087 | ||
| A549 | Function assay | 96 hrs | Down regulation of slug levels in human A549 cells up to 16 uM after 96 hrs by Western blot analysis | 30780087 | ||
| A549 | Function assay | 96 hrs | Up regulation of claudin-1 levels in human A549 cells up to 16 uM after 96 hrs by Western blot analysis | 30780087 | ||
| A549 | Function assay | 96 hrs | Up regulation of E-cadherin levels in human A549 cells up to 16 uM after 96 hrs by Western blot analysis | 30780087 | ||
| THP1 | Function assay | 4 uM | 3 days | Inhibition of LSD1 in human THP1 cells assessed as increase in CD86 expression at 4 uM incubated for 3 days by flow cytometric analysis | 31096156 | |
| Click to View More Cell Line Experimental Data | ||||||
Solubility
|
In vitro |
DMSO
: 57 mg/mL
(197.06 mM)
Water : 57 mg/mL |
Molarity Calculator
|
In vivo |
|||||
In vivo Formulation Calculator (Clear solution)
Step 1: Enter information below (Recommended: An additional animal making an allowance for loss during the experiment)
Step 2: Enter the in vivo formulation (This is only the calculator, not formulation. Please contact us first if there is no in vivo formulation at the solubility Section.)
Calculation results:
Working concentration: mg/ml;
Method for preparing DMSO master liquid: mg drug pre-dissolved in μL DMSO ( Master liquid concentration mg/mL, Please contact us first if the concentration exceeds the DMSO solubility of the batch of drug. )
Method for preparing in vivo formulation: Take μL DMSO master liquid, next addμL PEG300, mix and clarify, next addμL Tween 80, mix and clarify, next add μL ddH2O, mix and clarify.
Method for preparing in vivo formulation: Take μL DMSO master liquid, next add μL Corn oil, mix and clarify.
Note: 1. Please make sure the liquid is clear before adding the next solvent.
2. Be sure to add the solvent(s) in order. You must ensure that the solution obtained, in the previous addition, is a clear solution before proceeding to add the next solvent. Physical methods such
as vortex, ultrasound or hot water bath can be used to aid dissolving.
Chemical Information, Storage & Stability
| Molecular Weight | 289.24 | Formula | C14H22Cl2N2 |
Storage (From the date of receipt) | |
|---|---|---|---|---|---|
| CAS No. | 2102933-95-7 | Download SDF | Storage of Stock Solutions |
|
|
| Synonyms | N/A | Smiles | C1CNCCC1NC2CC2C3=CC=CC=C3.Cl.Cl | ||
Mechanism of Action
| Targets/IC50/Ki |
LSD1
(Cell-free assay) 16 nM
|
|---|---|
| In vitro |
GSK-LSD1 induces gene expression changes in cancer cell lines with average EC50 of < 5 nM and inhibits cancer cell line growth with average EC50 of < 5 nM. |
| In vivo |
GSK-LSD1, a highly selective inhibitor of KDM1A, significantly inhibits thyroid cancer progression and enhances the sensitivity of thyroid cancer to chemotherapy. |
References |
|
Applications
| Methods | Biomarkers | Images | PMID |
|---|---|---|---|
| Western blot | LSD1 / H3K4me2 |
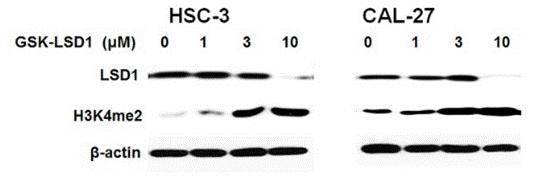
|
29088714 |
Tech Support
Tel: +1-832-582-8158 Ext:3
If you have any other enquiries, please leave a message.
Signaling Pathway Map
Products are for research use only. Not for human use. We do not sell to patients.
©Copyright 2013 Selleck Chemicals. All Rights Reserved.