-
 Australia
-
 Austria
-
 Belgium
-
 Brazil
-
 Canada
-
 China
China
-
 Czech Republic
-
 Denmark
-
 Finland
-
 France
-
 Germany
-
 Greece
-
 Hong Kong
-
 Hungary
-
 Iceland
-
 India
India
-
 Ireland
-
 Israel
-
 Italy
Italy
-
 Japan
Japan
-
 Korea
Korea
-
 Luxembourg
-
 Malaysia
-
 Netherlands
-
 New Zealand
-
 Norway
-
 Poland
-
 Qatar
Qatar
-
 Romania
-
 Saudi Arabia
-
 Singapore
-
 Spain
Spain
-
 Sweden
-
 Switzerland
-
 Taiwan
-
 Turkey
-
 United Kingdom
-
 United States
Anti-cancer Compound Library
Cat.No.L3000
A unique collection of 4249 anti-cancer compounds for multiple cancers: Breast Cancer, Leukemia, Lung Cancer, Lymphoma, etc.
Customize Your Library:
Cited by 378 Publications
| Featured Inhibitors | Y-27632 Dihydrochloride SB431542 CHIR-99021 (Laduviglusib) RMC-7977 RMC-6236 (Daraxonrasib) MRTX1133 MG132 Z-VAD-FMK VT3989 IAG933 |
|---|
Anti-cancer Compound Library Contents
Description & Advantages
Product Details
| Formulation | 3958 compounds pre-dissolved in 10mM DMSO, 162 compounds pre-dissolved in 10mM water, 120 compounds pre-dissolved in 2mM DMSO and 9 compounds pre-dissolved in 2mM water | ||
|---|---|---|---|
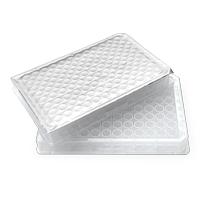
| Container | 96 Deep Well Plate Sealed With Aluminum Foil | ||
| Stability | 12 months | -20°C | in DMSO |
| 24 months | -80°C | in DMSO | |
| Shipping | Blue ice or dry ice | ||
Case Studies using Selleck Compound Libraries
-
Application of GPCR Compound Library in liver cancer (This article was published in Nature (IF=43) and took about 15 months):
-
Application of Kinase Inhibitor Library in colorectal cancer (This article was published in Nature Communications (IF=11) and took about 8 months):
-
Application of FDA-approved Drug Library in antivirus (This article was published in Cell Research (IF=17) and took about 13 months):
-
Application of FDA-approved Drug Library in metabolism (This article was published in Movement Disorders (IF=8) and took about 10 months):
-
Application of Epigenetics Compound Library in acute lymphoblastic leukemia (This article was published in Blood (IF=16) and took about 16 months):
-
Application of Inhibitor Library in tumor immunology (This article was published in Cancer Immunol Res (IF=8.6) and took about 12 months):
Anti-cancer Compound Library Composition
HTS Facility Partners


Products are for research use only. Not for human use. We do not sell to patients.
©Copyright 2013 Selleck Chemicals. All Rights Reserved.