Rapamycin Protocols | Working Concentration | Cell Culture | Incubation Time | Treatment
1
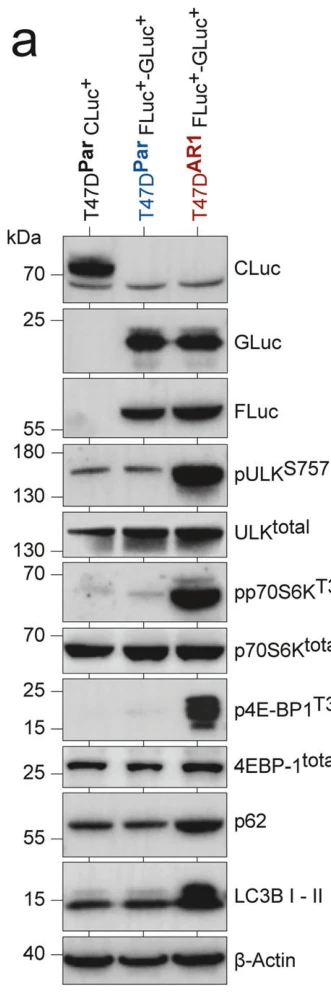
T47DAR1 · Cell Viability Assay
Research Field
Oncology
Sample
T47DAR1
Research Purpose
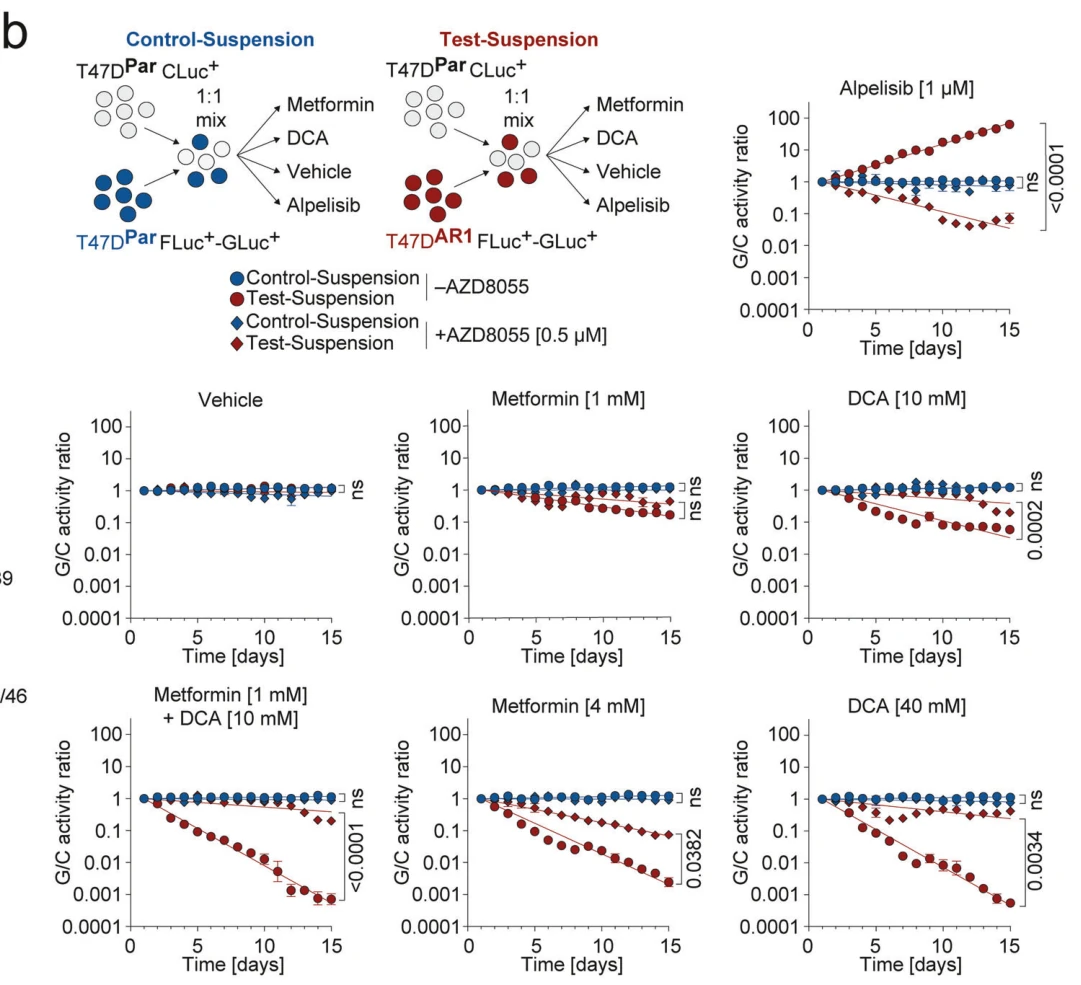
Effect of Rapamycin on resensitization to Alpelisib and resistance to metabolic drugs
Assay
Cell Viability Assay
Culture Conditions
high-glucose DMEM supplemented with 10% fetal bovine serum, 100 U ml−1 penicillin, 100 μg ml−1 streptomycin, and 0.4% Amphotericin B (250 μg mL−1) at 37 °C with 5% CO2
Co-treatment / Combination
Alpelisib, concurrent with Rapamycin, 5 days
Dichloroacetate, concurrent with Rapamycin, 5 days
Metformin, concurrent with Rapamycin, 5 days
Treatment
Rapamycin + Alpelisib / DCA / Metformin
Incubation Time
5 days
Control Setup
Untreated control, single-agent treatments
Results
Rapamycin resensitized Alpelisib-resistant T47DAR1 cells to Alpelisib, but rendered them resistant to metabolic drugs (DCA and Metformin).
Effect of Rapamycin on resensitization to Alpelisib and resistance to metabolic drugs
Assay
Cell Viability Assay
Culture Conditions
high-glucose DMEM supplemented with 10% fetal bovine serum, 100 U ml−1 penicillin, 100 μg ml−1 streptomycin, and 0.4% Amphotericin B (250 μg mL−1) at 37 °C with 5% CO2
Co-treatment / Combination
Alpelisib
Metformin
Dichloroacetate
Treatment
Rapamycin + Alpelisib, Rapamycin + Metformin, or Rapamycin + Dichloroacetate
Incubation Time
5 days
Control Setup
Untreated control, single-agent treatments
Results
Rapamycin resensitized Alpelisib-resistant T47DAR2 cells to Alpelisib, while rendering them resistant to metabolic drugs such as Metformin and Dichloroacetate.
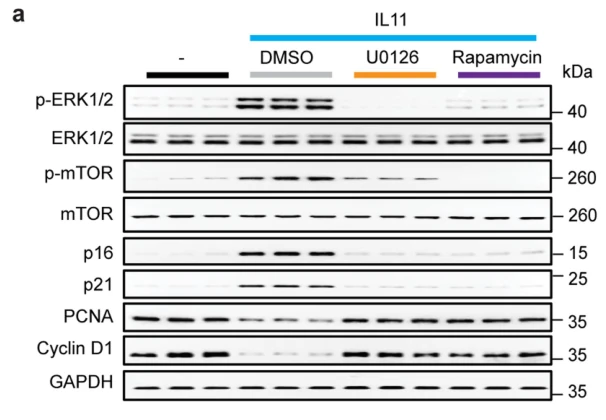
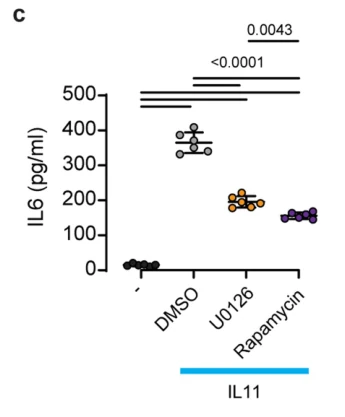
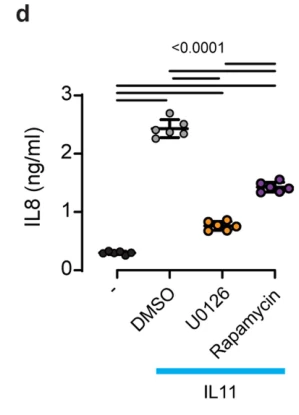
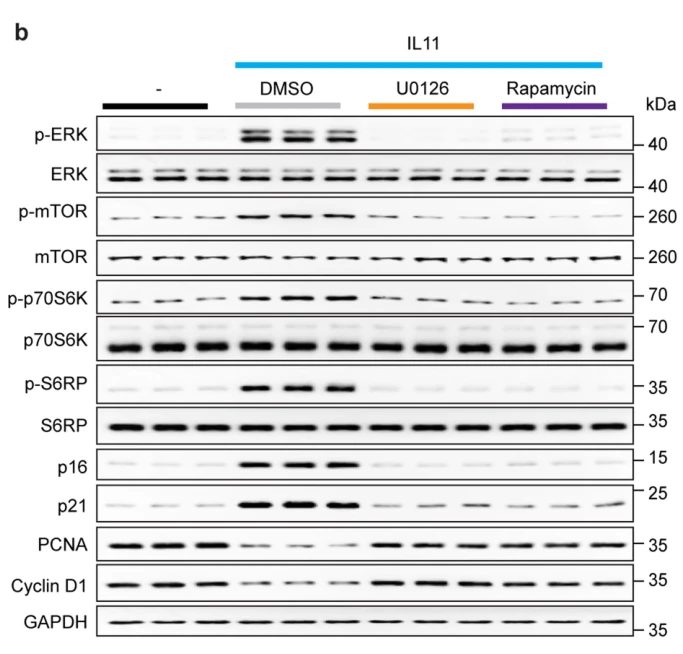
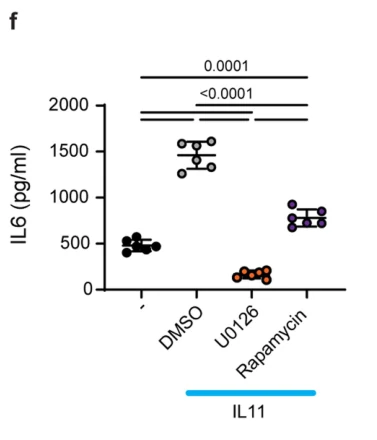
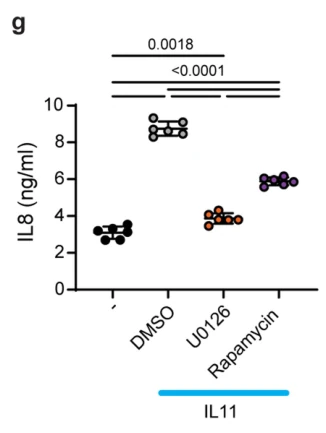
Rapamycin inhibited IL-11-induced phosphorylation of mTOR and upregulation of p16 and p21, and restored cyclin D1 and PCNA levels. In cell supernatants, rapamycin reduced IL-11-induced IL-6 secretion to ~40 pg/mL (p < 0.0001) and IL-8 secretion to ~1.3 ng/mL (p < 0.0001).
Extended Data Fig. 3a
Extended Data Fig. 3c
Extended Data Fig. 3d
4
Primary human hepatocytes · Western Blot, ELISA
Research Field
Cell Biology
Sample
Primary human hepatocytes
Research Purpose
Inhibition of IL-11-induced senescence and SASP markers by rapamycin in human hepatocytes
Assay
Western Blot, ELISA
Culture Conditions
Hepatocyte medium (5201, ScienCell) containing 2% FBS and 1% penicillin-streptomycin, 37 °C, 5% CO2; serum-starved overnight in basal media prior to stimulation
Seeding Density
4 × 10^5 cells per well in collagen-coated 6-well plate
Working Concentration
10 nM
Co-treatment / Combination
Recombinant human IL-11 10 ng/ml, concurrent with Rapamycin, 24 h
Rapamycin prevented IL-11-induced phosphorylation of mTOR, p70S6K, and S6RP, decreased p16 and p21 expression, restored PCNA and cyclin D1 levels, and significantly attenuated IL-11-stimulated secretion of IL-6 (p < 0.0001) and IL-8 (p = 0.0018) in primary human hepatocytes.
RPMI-1640 supplemented with 10% (v/v) FBS, 1% (v/v) HEPES (pH 7.2–7.5), 1% (v/v) penicillin/streptomycin, 1% (v/v) sodium pyruvate, 0.1% (v/v) 2-mercaptoethanol, 37 °C, 5% CO2
Seeding Density
3×10^5 cells/well in Seahorse culture plate
Working Concentration
100 nM
Co-treatment / Combination
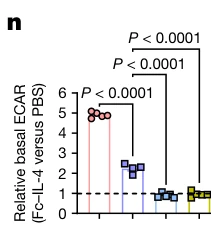
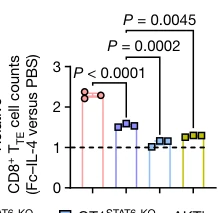
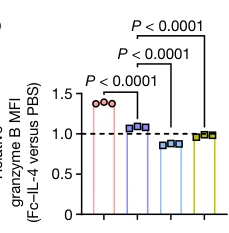
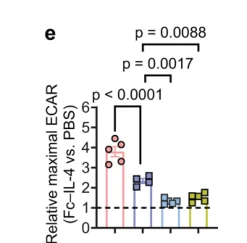
Fc-IL-4 20 ng/mL, concurrent with Rapamycin, 24 h or 48 h
dimeric anti-CD3 antibody 0.5 µg/mL, concurrent with Rapamycin, 24 h or 48 h
mouse IL-2 10 ng/mL, concurrent with Rapamycin, 24 h or 48 h
Pre-treatment Protocol
Splenocytes from Cas9 knock-in OT1 TCR-transgenic mice were activated with coated anti-CD3 (5 µg/mL) and soluble anti-CD28 (5 µg/mL) in the presence of IL-2 (10 ng/mL) for 1 day, spin-transduced on days 2 and 3 with retrovirus carrying STAT6-targeting gRNA pool (STAT6-1: 5'-CACCGTTGACTTTCCACAACGCCTA-3', STAT6-2: 5'-CACCGAGTTTACTACAGCCCTCGGA-3', STAT6-3: 5'-CACCGATAAAGCGCTGTGAGCGGAA-3'), expanded for 3 days, re-stimulated with dimeric anti-CD3 (0.5 µg/mL) for 2 days to induce PD-1+TIM-3+ CD8+ TTE cells, and sorted before inhibitor treatment
Treatment
Rapamycin + Fc-IL-4
Incubation Time
24 h or 48 h
Control Setup
Untreated/PBS vehicle, Fc-IL-4 alone, WT OT1 control, STAT6-KO without inhibitor
Figure 4n
Figure 4o
Figure 4p
Extended Data Fig. 9e
Extended Data Fig. 9f
Extended Data Fig. 9g
Extended Data Fig. 9h
Extended Data Fig. 9i
Extended Data Fig. 10c
6
Ex vivo-induced PMEL CD8+ TTE cells · Flow Cytometry
Research Field
Immunology
Sample
Ex vivo-induced PMEL CD8+ TTE cells
Research Purpose
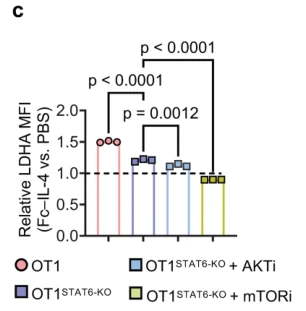
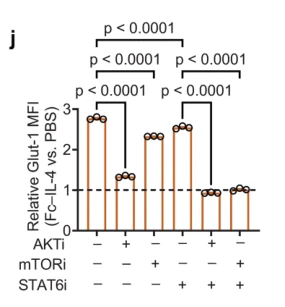
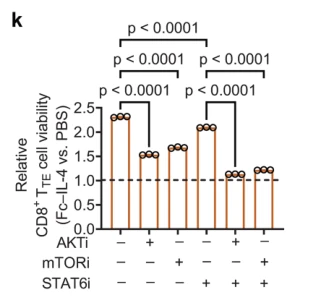
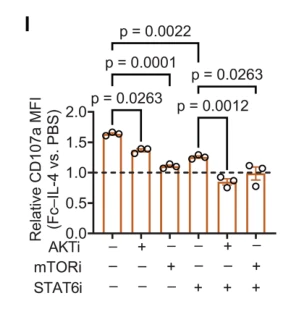
Involvement of mTOR pathway in Fc-IL-4-mediated metabolic and functional enhancement in PMEL CD8+ TTE cells
Assay
Flow Cytometry
Culture Conditions
complete RPMI medium supplemented with mouse IL-2 (10 ng ml-1), 37 °C
Working Concentration
100 nM
Co-treatment / Combination
dimeric anti-CD3 antibody 0.5 µg ml-1, concurrent with Rapamycin, 24 h
mouse IL-2 10 ng ml-1, concurrent with Rapamycin, 24 h
Fc-IL-4 20 ng ml-1, concurrent with Rapamycin, 24 h
AKT inhibitor VIII (HY-10355) 1 µM, concurrent with Rapamycin, 24 h
STAT6 inhibitor (AS1517499) 50 nM, concurrent with Rapamycin, 24 h
Treatment
Rapamycin + Fc-IL-4 + anti-CD3 + IL-2
Incubation Time
24 h
Control Setup
Untreated/vehicle control (PBS), Fc-IL-4 alone, AKT inhibitor VIII (alone or + Fc-IL-4), STAT6 inhibitor AS1517499 (alone or + Fc-IL-4), inhibitor combinations
Results
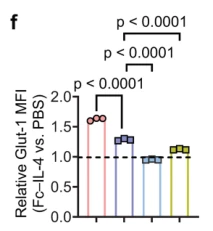
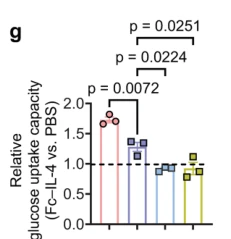
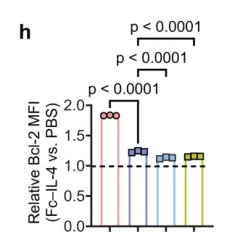
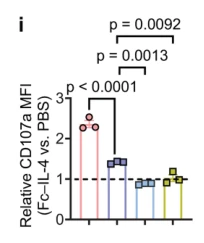
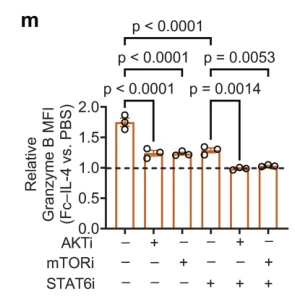
Inhibition of mTOR by Rapamycin (100 nM), alone or in combination with STAT6 inhibitor, significantly abolished Fc-IL-4-induced upregulation of Glut-1 MFI (p < 0.0001), cell viability (p < 0.0001), CD107a MFI (p = 0.0012), and Granzyme B MFI (p = 0.0014) in ex vivo-induced PMEL CD8+ TTE cells.
Extended Data Fig. 9j
Extended Data Fig. 9k
Extended Data Fig. 9l
Extended Data Fig. 9m
7
Primary CD8 T cells · Flow Cytometry
Research Field
Immunology
Sample
Primary CD8 T cells
Research Purpose
Effect of acute mTORC1 inhibition on asymmetric c-Myc and CD98 expression in first-division T cells
Assay
Flow Cytometry
Culture Conditions
RPMI 1640 supplemented with 10% (v/v) heat-inactivated FBS, 2 mM L-glutamine, 0.05 mM 2-mercaptoethanol, 100 units/ml penicillin and 100 µg/ml streptomycin at 37 °C in 5% CO2
Working Concentration
1 µM
Pre-treatment Protocol
Naïve T cells were labeled with CellTrace Violet and activated on plate-bound anti-CD3 (1 µg/mL), anti-CD28 (1 µg/mL), and recombinant human CD54/ICAM (0.5 µg/mL) for 35 h before compound addition
Treatment
Rapamycin
Incubation Time
45 min
Control Setup
DMSO vehicle control
Results
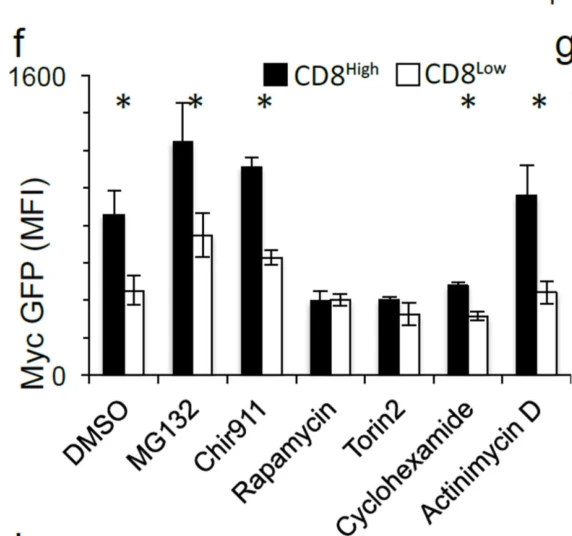
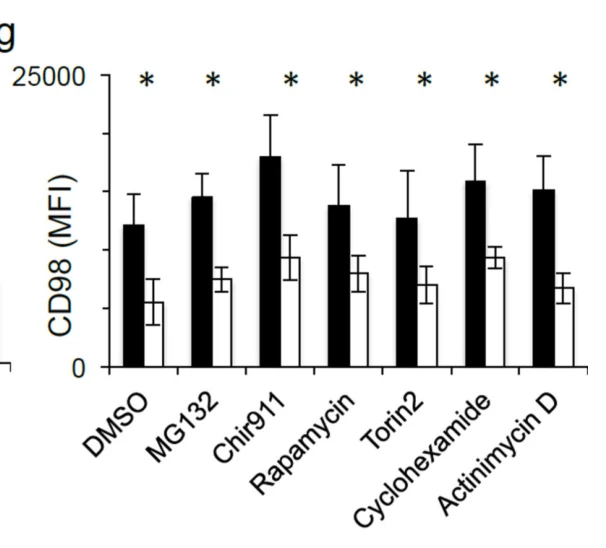
Acute treatment with rapamycin reduced c-Myc-GFP expression in first-division CD8high T cells to the level of CD8low cells, abolishing c-Myc asymmetry, while CD98 asymmetry remained unaffected (p < 0.05 for c-Myc-GFP in DMSO vs. non-significant under rapamycin).
C57BL/6 mice transferred with sorted first-division c-Myc-GFPhigh or c-Myc-GFPlow OT-I CD8 T cells · Flow Cytometry
Research Field
Immunology
Sample
C57BL/6 mice transferred with sorted first-division c-Myc-GFPhigh or c-Myc-GFPlow OT-I CD8 T cells
Research Purpose
Effect of in vivo mTORC1 inhibition with rapamycin on secondary recall response of transferred c-Mychigh vs c-Myclow CD8 T cells
Assay
Flow Cytometry
Working Concentration
75 ug/kg
Co-treatment / Combination
HKx31-SIINFEKL influenza 10^6 EID50, i.v. infection at day 0
PR8-SIINFEKL influenza, challenge infection 4 weeks post-transfer (after 2 weeks rest), 9 days before harvest
Pre-treatment Protocol
Naïve c-Myc-GFP OT-I CD8 T cells were labeled with Cell Trace Violet, activated in vitro on plate-bound anti-CD3/CD28/ICAM or SIINFEKL-pulsed BMDCs for 36 h, sorted into first-division c-Myc-GFPhigh or c-Myc-GFPlow populations, and 2.5×10^5, 5×10^5, or 7.5×10^5 cells were adoptively transferred i.v. into recipient mice
Treatment
Rapamycin + HKx31-SIINFEKL + PR8-SIINFEKL
Incubation Time
10 days (daily I.P. injections on days 0–10 post primary infection)
Control Setup
PBS vehicle control in c-Myc-GFPhigh recipient mice, c-Myc-GFPlow recipient mice without rapamycin
Results
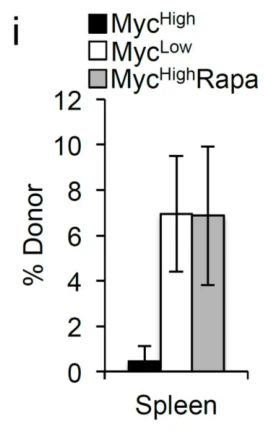
In PBS-treated controls, c-Myc-GFPlow donor cells generated a significantly higher secondary recall frequency than c-Myc-GFPhigh cells (p=0.0128), whereas in vivo rapamycin administration restored the secondary recall capacity of c-Myc-GFPhigh donor cells to levels equivalent to c-Myc-GFPlow cells (p=0.9726).
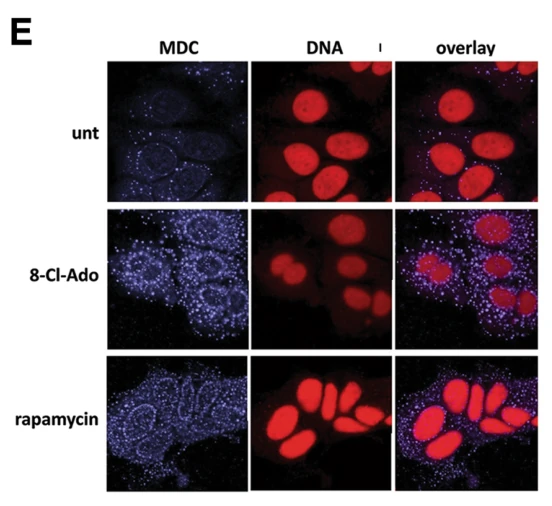
Induction of autophagy and acidic vesicular organelles
Assay
Fluorescence Microscopy
Culture Conditions
DMEM:F12 supplemented with 10% fetal bovine serum, 5% CO2, 37°C
Seeding Density
1.5 × 10^4 cells/chamber in 4-well chamber slides
Working Concentration
50 nM
Treatment
Rapamycin
Incubation Time
2-days
Control Setup
untreated MCF-7 cells
Results
Treatment of MCF-7 cells with 50 nM rapamycin induced the formation of large monodansylcadaverine (MDC)-positive acidic vesicular organelles, comparable to the induction observed with 8-chloro-adenosine.
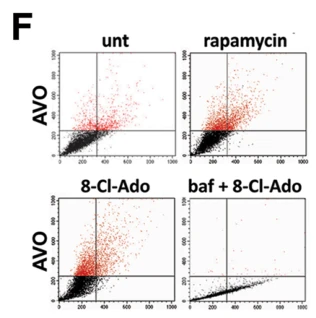
Induction of autophagy and acidic vesicular organelles
Assay
Flow Cytometry
Culture Conditions
DMEM:F12 supplemented with 10% fetal bovine serum, 5% CO2, 37°C
Working Concentration
50 nM
Treatment
Rapamycin
Incubation Time
3 days
Control Setup
Untreated control, 8-Cl-Ado (10 µM), and bafilomycin A1 (0.1 µg/mL)
Results
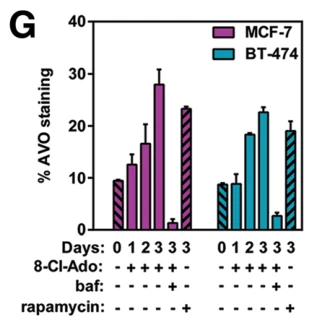
Treatment with 50 nM rapamycin for 3 days led to a 14% increase in AVO staining in MCF-7 cells, comparable to the 18% increase observed with 10 µM 8-Cl-Ado.
Treatment with 50 nM rapamycin for 3 days caused an approximate 10% increase in AVO staining in BT-474 cells, serving as a positive control comparable to 8-Cl-Ado-mediated autophagy induction.
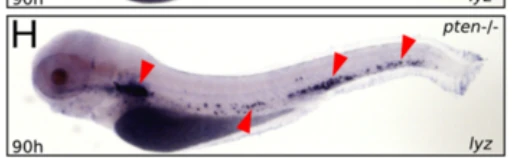
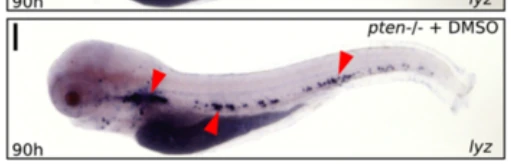
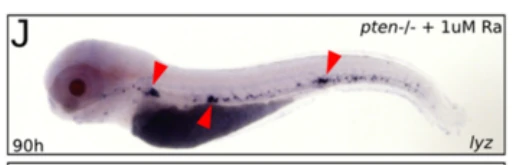
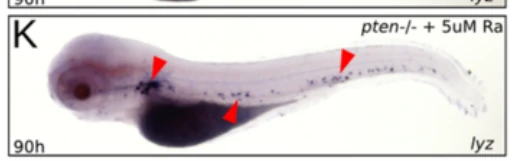
Pten-/- zebrafish embryos · Whole-Mount in Situ Hybridization
Research Field
Cell Biology
Sample
Pten-/- zebrafish embryos
Research Purpose
Rescuing expansive myelopoiesis in pten-/- embryos by mTOR inhibition
Assay
Whole-Mount in Situ Hybridization
Culture Conditions
egg water, standard zebrafish maintenance at 28.5 °C
Working Concentration
1, 5, 20 µM
Treatment
Rapamycin
Incubation Time
12 h (from 78 to 90 hpf)
Control Setup
Untreated control embryos, untreated pten-/- embryos, DMSO-treated pten-/- embryos
Results
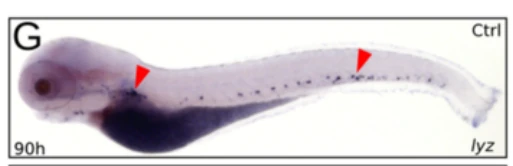
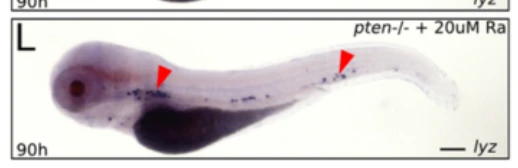
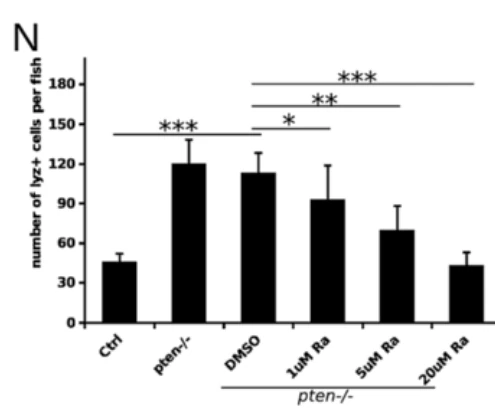
Rapamycin treatment from 78 to 90 hpf rescued the expansive myelopoiesis phenotype in pten-/- embryos in a dose-dependent manner (Figure 4G-L, N), with 20 µM rapamycin reducing lyz-positive cells per fish to levels below control embryos (p < 0.001).
Pten-/- (ptena-/- ptenb-/-) zebrafish embryos · Sudan Black Staining
Research Field
Cell Biology
Sample
Pten-/- (ptena-/- ptenb-/-) zebrafish embryos
Research Purpose
Neutrophil maturation rescue
Assay
Sudan Black Staining
Culture Conditions
egg water, 28.5 °C
Working Concentration
5 µM
Treatment
Rapamycin
Incubation Time
12 h
Control Setup
DMSO vehicle-treated pten-/- embryos, DMSO-treated control embryos, rapamycin-treated control embryos
Results
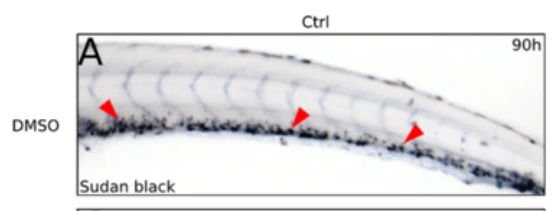
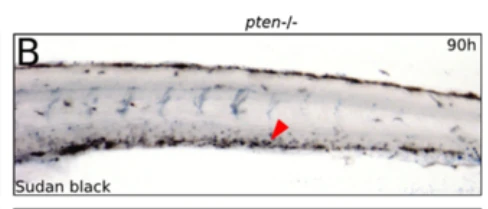
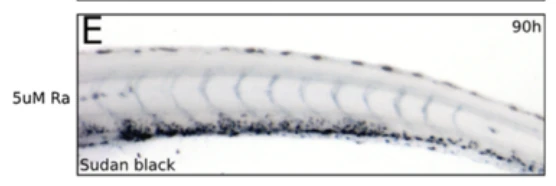
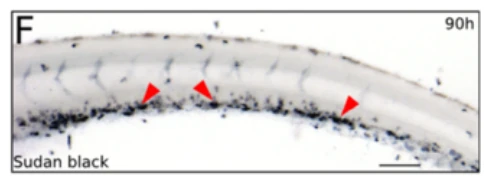
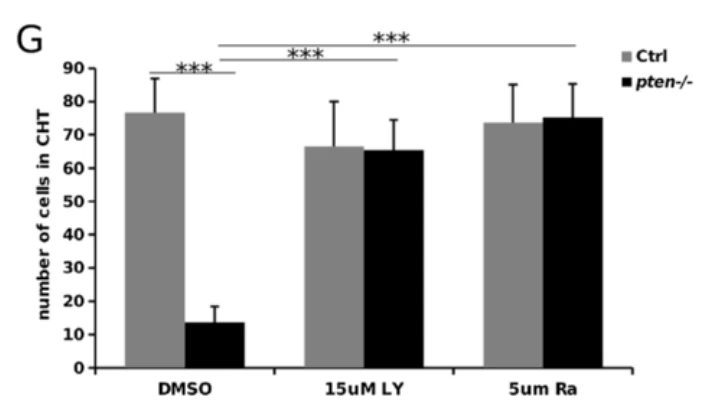
Treatment with 5 µM rapamycin from 78 to 90 hpf largely rescued the maturation block of neutrophils in pten-/- embryos, restoring Sudan Black-positive granulocytes in the CHT to ~70 cells, comparable to control levels.
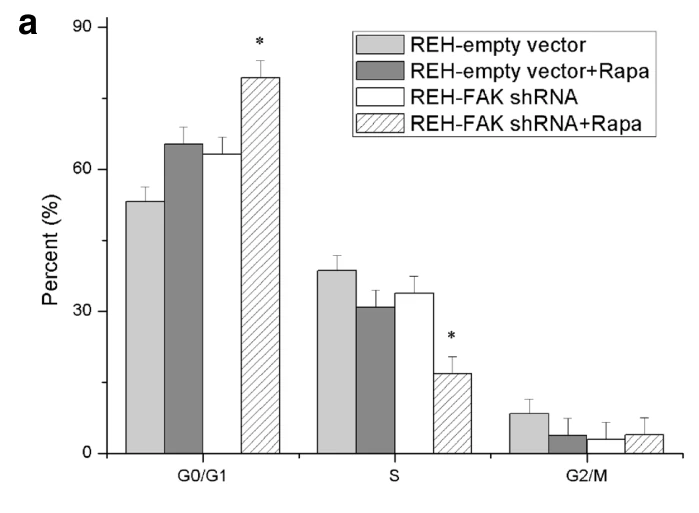
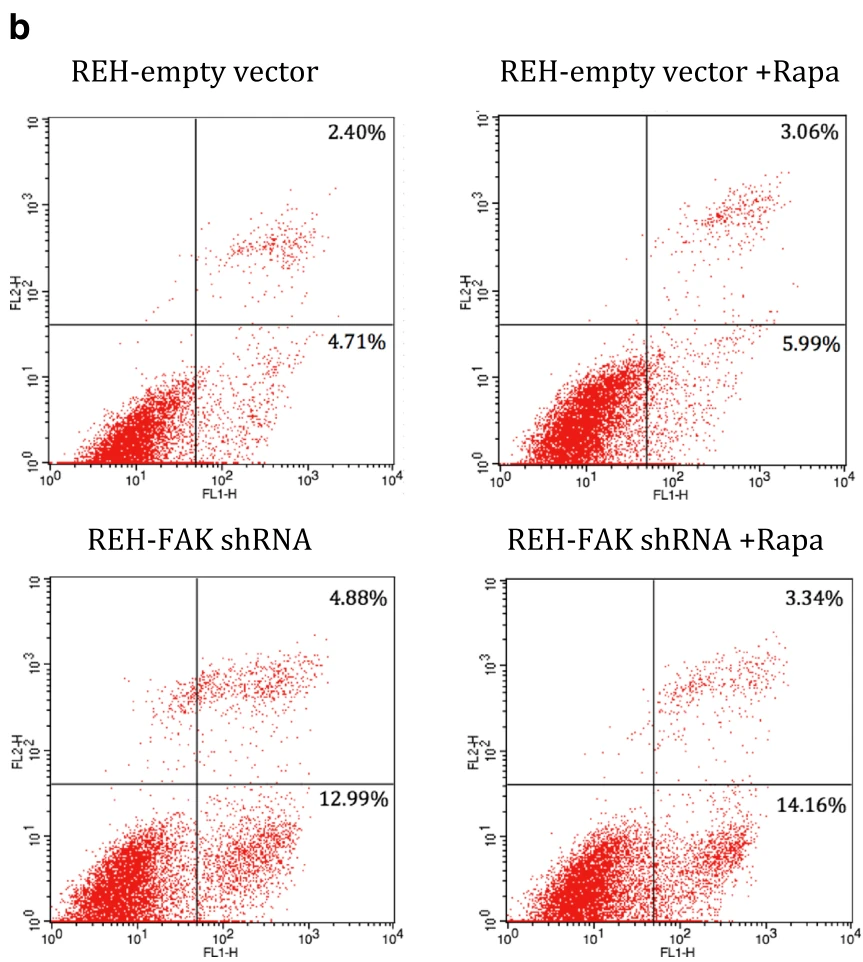
Rapamycin alone arrested 65.34 ± 3.62% of REH-empty vector cells in G0/G1 phase, while the combination of rapamycin and FAK shRNA significantly increased G0/G1 arrest to 79.35 ± 3.28% (p < 0.05) with a concomitant decrease in S phase.
Lentiviral GFP-FAK shRNA (designated FAK X40-2 shRNA, target sequence 5'-GGAATGCTTCAAGTGTGCTT-3') or GFP-empty vector construct transduced into REH cells, followed by FACS sorting based on GFP expression at 72 h post-transfection until >99% GFP-positive clones were obtained
Treatment
Rapamycin
Incubation Time
30 h
Control Setup
REH-empty vector without rapamycin, REH-empty vector with rapamycin, REH-FAK shRNA without rapamycin
Results
The percentage of Annexin V+ apoptotic cells was significantly elevated in the combination treatment group compared to rapamycin alone (17.50 ± 0.55% vs 9.05 ± 0.41%, p < 0.05).
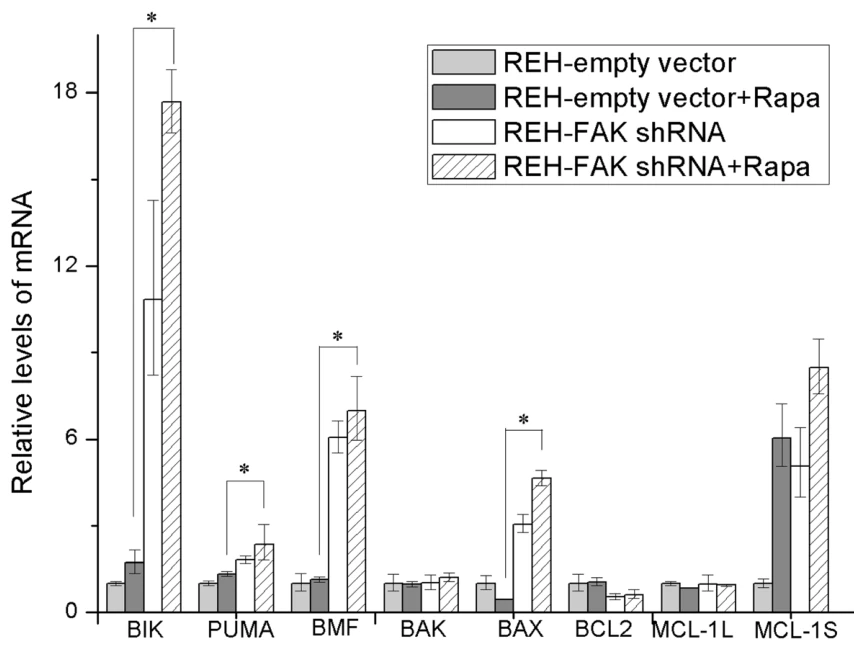
FAK knockdown via lentiviral-GFP-FAK-shRNA (designated FAK X40-2 shRNA, target sequence 5'-GGAATGCTTCAAGTGTGCTT-3') or lentiviral GFP-empty vector, followed by repeated FACS sorting at 72 h post-transfection until >99% GFP-positive clones were established before rapamycin treatment
NOD/SCID mice · In Vivo Survival Analysis, Complete Blood Count, and Spleen Morphology Analysis
Research Field
Oncology
Sample
NOD/SCID mice
Research Purpose
In vivo therapeutic efficacy, leukemia progression, and survival analysis under rapamycin treatment and FAK knockdown
Assay
In Vivo Survival Analysis, Complete Blood Count, and Spleen Morphology Analysis
Working Concentration
1.5 mg/kg
Pre-treatment Protocol
Five million REH cells stably transduced with GFP-FAK shRNA lentivirus (target sequence 5′-GGAATGCTTCAAGTGTGCTT-3′; designated FAK X40-2 shRNA; sorted by FACSAria for >99% GFP positivity) or GFP-empty vector construct were injected via tail vein into 6- to 8-week-old NOD/SCID mice 10 days before treatment initiation
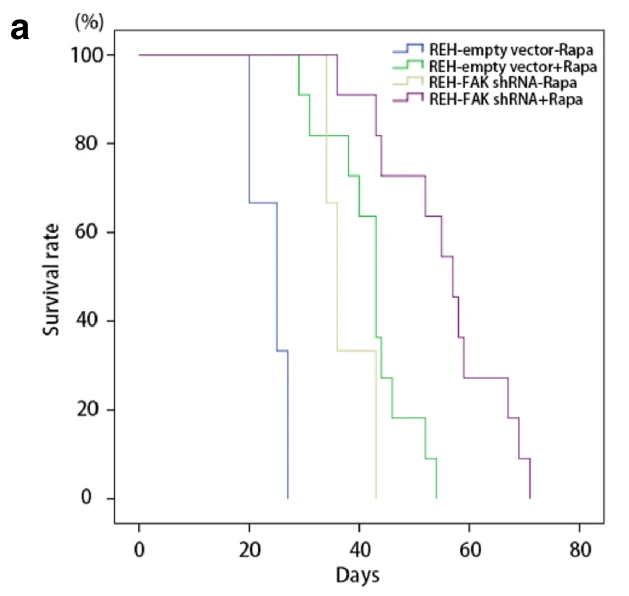
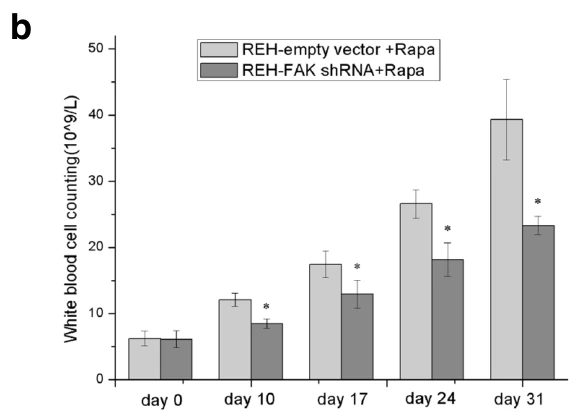
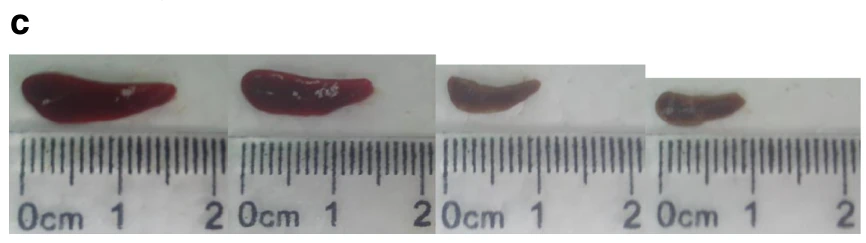
In REH-empty vector mice, rapamycin treatment resulted in median survival of 43 days (range 29–52 days, n = 11), whereas in REH-FAK shRNA mice, rapamycin significantly extended median survival to 57 days (range 43–71 days, n = 11; p < 0.05). Combination of rapamycin and FAK shRNA significantly suppressed peripheral WBC counts compared to rapamycin alone (p < 0.01) and reduced splenomegaly measured on day 25.
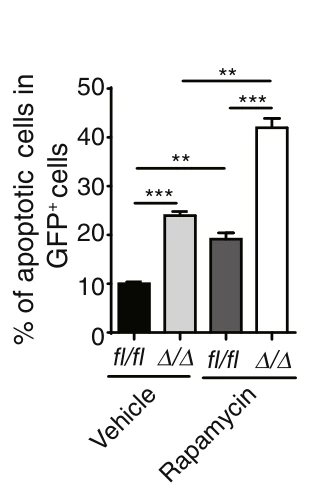
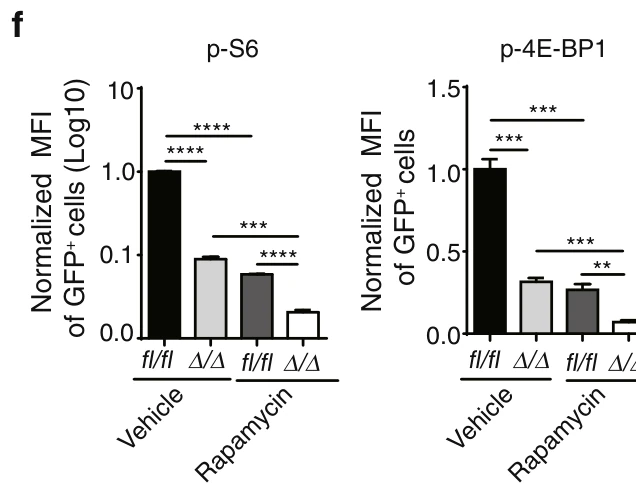
In Rheb1fl/fl GFP+ AML cells, rapamycin treatment significantly increased the percentage of apoptotic cells compared with vehicle control (p < 0.01) and markedly suppressed mTORC1 signaling as shown by decreased normalized MFI of p-S6 (p < 0.001) and p-4E-BP1 (p < 0.001).
In Rheb1Δ/Δ GFP+ AML cells, rapamycin treatment significantly increased the percentage of apoptotic cells to ~44% compared to ~26% in vehicle-treated Rheb1Δ/Δ cells, while further reducing normalized MFI of p-S6 and p-4E-BP1 compared to vehicle-treated Rheb1Δ/Δ cells (p < 0.001 and p < 0.01).
BALB/c nu/nu mice · Histological Analysis and Immunohistochemistry
Research Field
Oncology
Sample
BALB/c nu/nu mice
Research Purpose
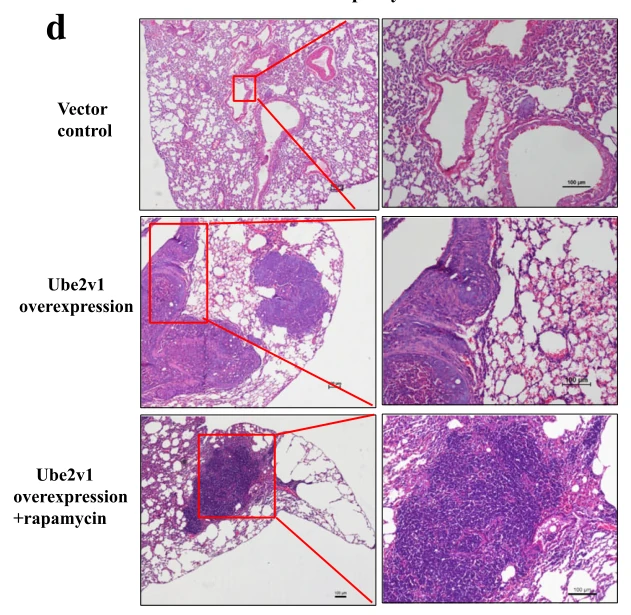
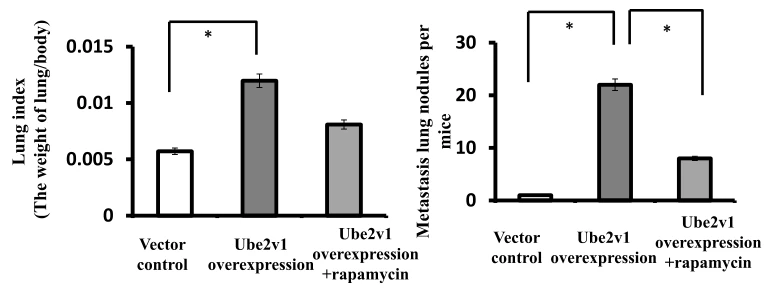
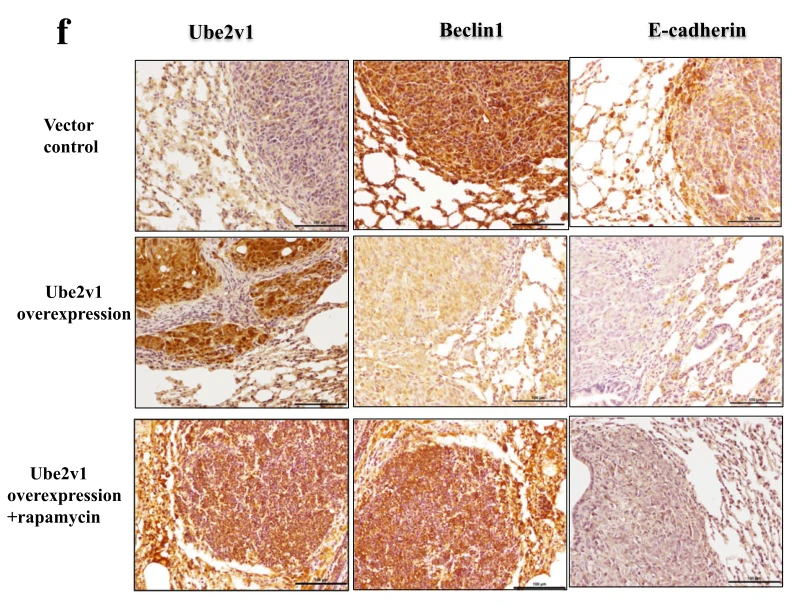
In vivo effect of rapamycin on Ube2v1-mediated lung metastasis
Assay
Histological Analysis and Immunohistochemistry
Working Concentration
5 mg/kg
Pre-treatment Protocol
SW480 cells stably overexpressing Ube2v1 (using GV218 lentiviral vector selected with 1 mg/ml puromycin; Genechem) or vector control cells (1 × 10^7 cells in 0.2 ml) injected into the lateral tail vein of 6-week-old BALB/C-nu mice
Treatment
Rapamycin
Incubation Time
2 weeks
Control Setup
Vector control, Ube2v1 overexpression alone
Results
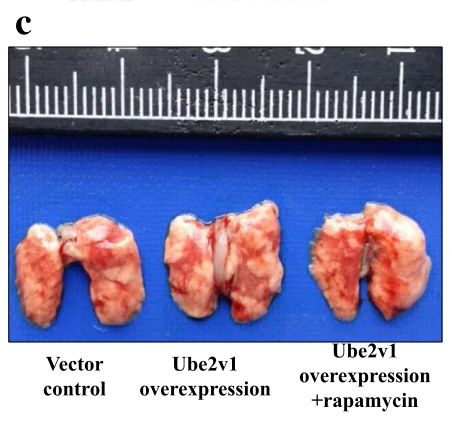
Administration of rapamycin significantly reduced the lung index and surface metastatic nodule numbers in mice injected with Ube2v1-overexpressing SW480 cells (p < 0.05), while restoring Beclin1 and E-cadherin expression in lung metastases.