
-
 Argentina
-
 Australia
-
 Austria
-
 Belgium
-
 Brazil
-
 Canada
-
 China
China
-
 Czech Republic
-
 Denmark
-
 Finland
-
 France
-
 Germany
-
 Greece
-
 Hong Kong
-
 Hungary
-
 Iceland
-
 India
India
-
 Ireland
-
 Israel
-
 Italy
Italy
-
 Japan
Japan
-
 Korea
Korea
-
 Luxembourg
-
 Malaysia
-
 Netherlands
-
 New Zealand
-
 Norway
-
 Poland
-
 Portugal
-
 Qatar
Qatar
-
 Romania
-
 Saudi Arabia
-
 Singapore
-
 Spain
Spain
-
 Sweden
-
 Switzerland
-
 Taiwan
-
 Turkey
-
 United Kingdom
-
 United States
research use only
FGF-19 Antibody (Mouse mAb) [L9N16]
CatNo: F8862
Application:
Reactivity:
-
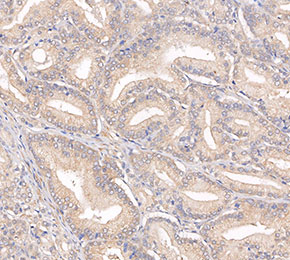 Immunohistochemical analysis of formalin fixed paraffin embedded human prostate cancer tissue with F8862 at 1:30 dilution.
Experiment Essentials
WB
Recommended wet transfer conditions: 200 mA, 60 min.
Usage Information
| Dilution |
|---|
|
| Application |
|---|
| WB, IHC |
| Reactivity |
|---|
| Human |
| Source |
|---|
| Mouse Monoclonal Antibody |
| Storage Buffer |
|---|
| PBS, pH 7.2+50% Glycerol+0.05% BSA+0.01% NaN3 |
| Storage (from the date of receipt) |
|---|
| -20°C (avoid freeze-thaw cycles), 2 years |
| Predicted MW |
|---|
| 24 kDa |
| Positive Control | Human prostate cancer tissue |
|---|---|
| Negative Control |
Experimental Methods
| WB |
|---|
Experimental Protocol:
Sample preparation
1. Tissue: Lyse the tissue sample by adding an appropriate volume of ice-cold RIPA/Nuclear Lysis Buffer (containing Protease Inhibitor Cocktail),and homogenize the tissue at a low temperature or lyse it by sonication on ice, then incubate on ice for 30 minutes.
2. Adherent cell: Aspirate the culture medium and wash the cells with ice-cold PBS twice. Lyse the cells by adding an appropriate volume of RIPA/Nuclear Lysis Buffer (containing Protease Inhibitor Cocktail) , sonicate to lyse the cells, and incubate on ice for 30 minutes.
3. Suspension cell: Transfer the culture medium to a pre-cooled centrifuge tube. Centrifuge and aspirate the supernatant. Wash the cells with ice-cold PBS twice. Lyse the cells by adding an appropriate volume of RIPA/Nuclear Lysis Buffer (containing Protease Inhibitor Cocktail) , sonicate to lyse the cells, and incubate on ice for 30 minutes.
4. Place the lysate into a pre-cooled microcentrifuge tube. Centrifuge at 4°C for 15 min. Collect the supernatant;
5. Remove a small volume of lysate to determine the protein concentration;
6. Combine the lysate with protein loading buffer. Boil 20 µL sample under 95-100°C for 5 min. Centrifuge for 5 min after cool down on ice.
Electrophoretic separation
1. According to the concentration of extracted protein, load appropriate amount of protein sample and marker onto SDS-PAGE gels for electrophoresis. Recommended separating gel (lower gel) concentration: 10%. Reference Table for Selecting SDS-PAGE Separation Gel Concentrations
2. Power up 80V for 30 minutes. Then the power supply is adjusted (110 V~150 V), the Marker is observed, and the electrophoresis can be stopped when the indicator band of the predyed protein Marker where the protein is located is properly separated. (Note that the current should not be too large when electrophoresis, too large current (more than 150 mA) will cause the temperature to rise, affecting the result of running glue. If high currents cannot be avoided, an ice bath can be used to cool the bath.)
Transfer membrane
1. Take out the converter, soak the clip and consumables in the pre-cooled converter;
2. Activate PVDF membrane with methanol for 1 min and rinse with transfer buffer;
3. Install it in the order of "black edge of clip - sponge - filter paper - filter paper - glue -PVDF membrane - filter paper - filter paper - sponge - white edge of clip";
4. The protein was electrotransferred to PVDF membrane. ( 0.45 µm PVDF membrane is recommended ) Reference Table for Selecting PVDF Membrane Pore Size Specifications
Recommended conditions for wet transfer: 200 mA, 60 min.
( Note that the transfer conditions can be adjusted according to the protein size. For high-molecular-weight proteins, a higher current and longer transfer time are recommended. However, ensure that the transfer tank remains at a low temperature to prevent gel melting.)
Block
1. After electrotransfer, wash the film with TBST at room temperature for 5 minutes;
2. Incubate the film in the blocking solution for 1 hour at room temperature;
3. Wash the film with TBST for 3 times, 5 minutes each time.
Antibody incubation
1. Use primary antibody dilution buffer to prepare the primary antibody working liquid (recommended dilution ratio for primary antibody 1:1000), gently shake and incubate with the film at 4°C overnight;
2. Wash the film with TBST 3 times, 5 minutes each time;
3. Add the secondary antibody to the blocking solution and incubate with the film gently at room temperature for 1 hour;
4. After incubation, wash the film with TBST 3 times for 5 minutes each time.
Antibody staining
1. Add the prepared ECL luminescent substrate (or select other color developing substrate according to the second antibody) and mix evenly;
2. Incubate with the film for 1 minute, remove excess substrate (keep the film moist), wrap with plastic film, and expose in the imaging system. |
| IHC |
|---|
Experimental Protocol:
Deparaffinization/Rehydration
1. Deparaffinize/hydrate sections:
2. Incubate sections in three washes of xylene for 5 min each.
3. Incubate sections in two washes of 100% ethanol for 10 min each.
4. Incubate sections in two washes of 95% ethanol for 10 min each.
5. Wash sections two times in dH2O for 5 min each.
6.Antigen retrieval: For Citrate: Heat slides in a microwave submersed in 1X citrate unmasking solution until boiling is initiated; continue with 10 min at a sub-boiling temperature (95°-98°C). Cool slides on bench top for 30 min.
Staining
1. Wash sections in dH2O three times for 5 min each.
2. Incubate sections in 3% hydrogen peroxide for 10 min.
3. Wash sections in dH2O two times for 5 min each.
4. Wash sections in wash buffer for 5 min.
5. Block each section with 100–400 µl of blocking solution for 1 hr at room temperature.
6. Remove blocking solution and add 100–400 µl primary antibody diluent in to each section. Incubate overnight at 4°C.
7. Remove antibody solution and wash sections with wash buffer three times for 5 min each.
8. Cover section with 1–3 drops HRPas needed. Incubate in a humidified chamber for 30 min at room temperature.
9. Wash sections three times with wash buffer for 5 min each.
10. Add DAB Chromogen Concentrate to DAB Diluent and mix well before use.
11. Apply 100–400 µl DAB to each section and monitor closely. 1–10 min generally provides an acceptable staining intensity.
12. Immerse slides in dH2O.
13. If desired, counterstain sections with hematoxylin.
14. Wash sections in dH2O two times for 5 min each.
15. Dehydrate sections: Incubate sections in 95% ethanol two times for 10 sec each; Repeat in 100% ethanol, incubating sections two times for 10 sec each; Repeat in xylene, incubating sections two times for 10 sec each.
16. Mount sections with coverslips and mounting medium.
|
Biological Description
| Specificity |
|---|
| FGF-19 Antibody (Mouse mAb) [L9N16] detects endogenous levels of total FGF-19 protein. |
| Subcellular Location |
|---|
| Secreted |
| Uniprot ID |
|---|
| O95750 |
| Clone |
|---|
| L9N16 |
| Synonym(s) |
|---|
| FGF-19 | FGF19 | Fibroblast growth factor 19 |
| Background |
|---|
| FGF‑19 is an endocrine member of the fibroblast growth factor family that links bile acid sensing in the distal intestine to metabolic and proliferative signaling in the liver through selective activation of FGFR4–β‑Klotho receptor complexes. The protein shares the conserved FGF core fold that supports heparin binding and receptor engagement but displays distinctive sequence features that confer high affinity and functional specificity for FGFR4, positioning it as a ligand with restricted receptor usage compared with many paracrine FGFs. FGF‑19 expression in ileal enterocytes is induced by bile acid–activated farnesoid X receptor, and the secreted hormone enters the portal circulation to engage FGFR4–β‑Klotho on hepatocytes, where receptor autophosphorylation triggers downstream kinase cascades including ERK and other MAPK branches that repress transcription of the bile acid synthesis enzyme CYP7A1 and adjust bile acid transport and conjugation pathways. Through these mechanisms, FGF‑19 establishes a negative feedback loop that stabilizes bile acid pool size and composition after feeding and coordinates intestinal uptake with hepatic synthesis to maintain bile acid homeostasis. FGF‑19 also signals through FGFR4–β‑Klotho and, in some contexts, through β‑Klotho complexes with other FGFRs in metabolic tissues to influence glucose utilization, lipid handling, and energy expenditure, integrating nutrient status with transcriptional programs that regulate gluconeogenesis, glycogen storage, and lipid metabolism. Persistent or ectopic FGF‑19–FGFR4 activation in the liver engages mitogenic signaling outputs of FGFR4, including sustained ERK pathway activity and associated transcriptional responses, and this mode of signaling is linked to hepatocyte hyperproliferation and hepatocellular carcinoma in experimental models where FGF‑19 acts as an oncogenic driver. In tumor such as liver and lung squamous cell carcinoma, FGF‑19 expression and amplification create an autocrine loop with FGFR4 that supports cell-cycle progression, survival, and invasiveness, aligning receptor phosphorylation and downstream pathway activation with aggressive growth behavior. |
| References |
|---|
|
Tech Support
Tel: +1-832-582-8158 Ext:3
If you have any other enquiries, please leave a message.

Products are for research use only. Not for human use. We do not sell to patients.
©Copyright 2013 Selleck Chemicals. All Rights Reserved.